

Evidence that is deemed 'Jury-convincing'
Evidence that is deemed 'Jury-convincing'
Post #852

In order to convince a jury that a suspect is the culprit of a crime, DNA evidence is sometimes submitted. Some spots along the DNA are highly variable, so that different people have different alleles — or more particularly, nucleotides (A, C, G, or T) — in certain positions (loci) along the genome. Some changes can change your features:
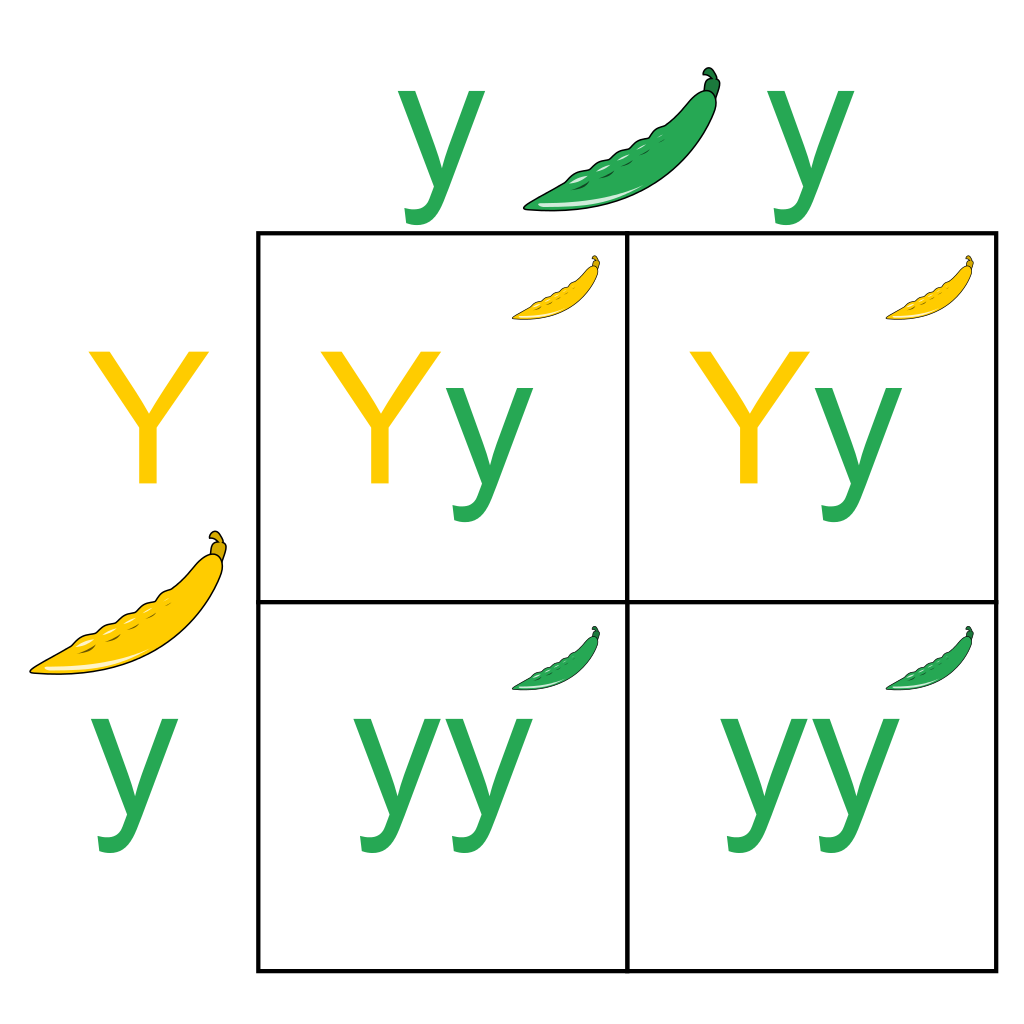
Page URL: https://commons.wikimedia.org/wiki/File:Punnett_Square.svg
Attribution: Pbroks13, CC BY-SA 3.0 <https://creativecommons.org/licenses/by-sa/3.0>, via Wikimedia Commons
But even if a change in a spot of DNA doesn’t change anything about you, it can still be used in order to determine if you are a DNA match, such as for paternity tests and forensic crime scene analysis. Several spots (loci) are tested to get a “DNA signature” which is unlikely to be replicated by the DNA from random people.
A rule of thumb for convincing a jury is to discover that the DNA left at a crime scene is one million times more likely to have come from the suspect than from a random person. There might be a tiny probability that some random person left it, but if the probability that it came from the suspect is a million times higher, the jury convicts.
Thought Experiment
If an unknown number of dice were rolled, and the summed outcome was “6” — then what chance is there that it was two dice that were rolled vs. three of them? You can obtain the probability of getting a “6” out of two dice, and then you can compare that probability with that of getting a “6” when rolling three dice all at once.
By dividing the larger probability by the smaller one, you make a Likelihood Ratio. When a Likelihood Ratio reaches “a million-to-one” then juries are ready to convict. If many rolls were repeated, back-to-back, and it just so happened that “6” always came up, the probabilities diverge very far from each other:
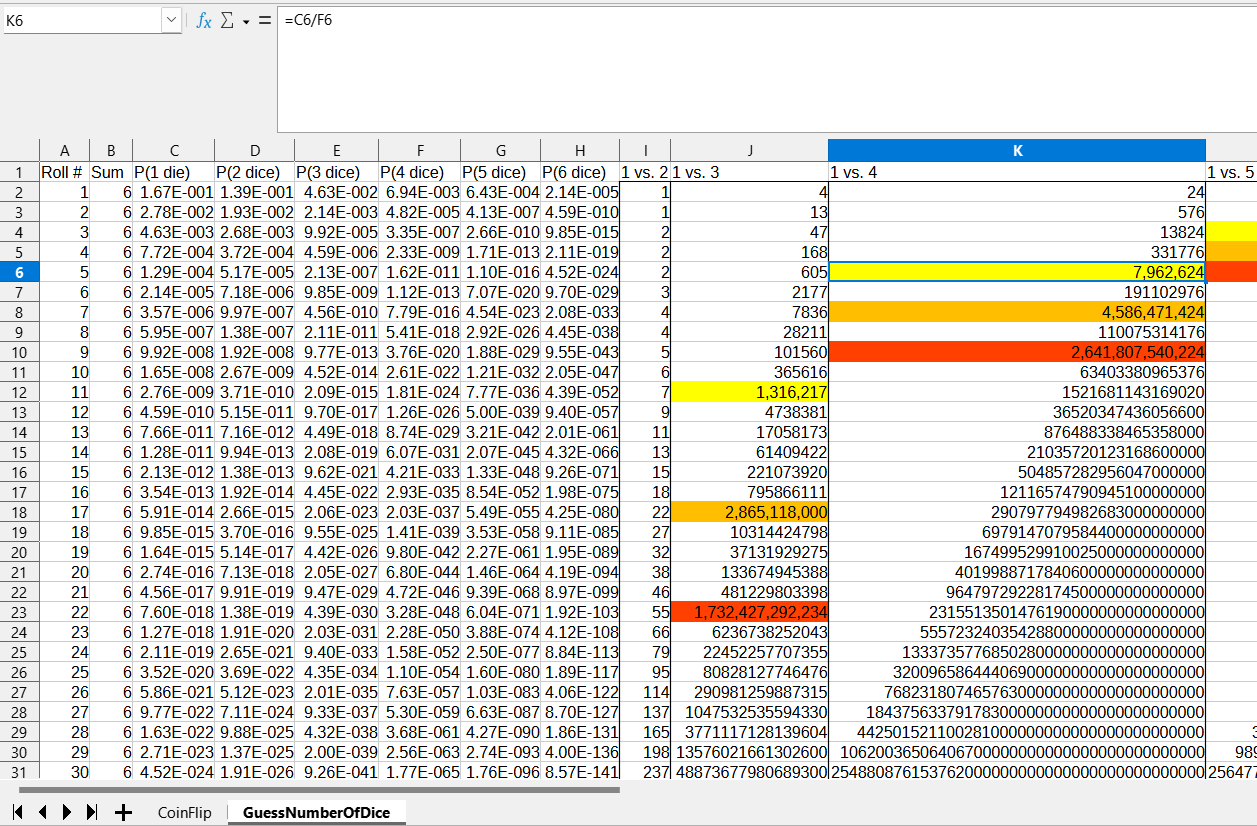
Row 6 shows the fifth roll of an unknown number of dice. At that point, when presented with these two possibilities:
1) all 5 sixes came from rolling 1 die only each time, or
2) all 5 sixes came from rolling 4 dice each time (e.g., 2+1+1+2 = 6)
… then the yellow-shaded cell in column K shows that it is 8 million times more likely that you had been rolling one die each time, compared to rolling 4 dice each time.
Yellow cells show when the Likelihood Ratio exceeds 1 million. Orange cells show when it exceeds 1 billion. Red cells show when it exceeds 1 trillion. If a jury was presented with evidence so strong that it led to a Likelihood Ratio of a trillion, it’d mean that the suspect is a trillion times more likely to have left the DNA sample.
Getting a “6” from rolling 6 dice has the lowest probability and, when compared to rolling one die, probabilities diverge very quickly:
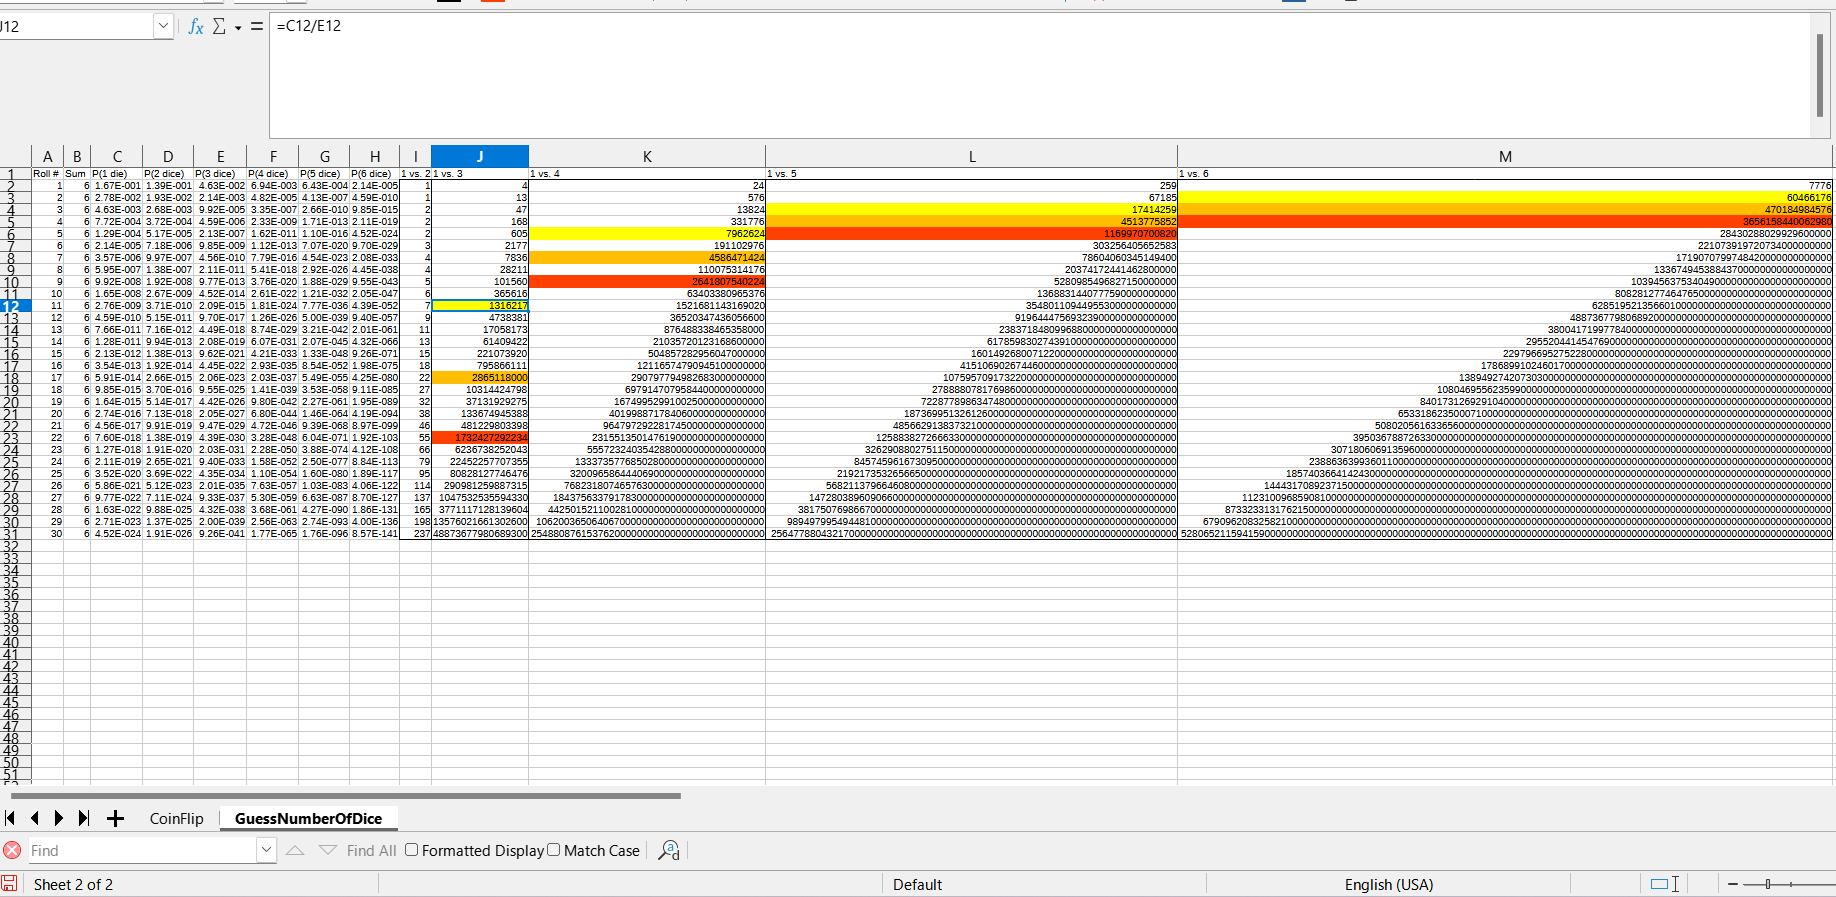
Even by the second roll of the dice (yellow cell at top right), it is already 6 million times more likely that the number of dice that led to you getting two sixes in a row is just one die rather than 6 of them. By the third roll, it becomes 470 billion times more likely that you had been rolling one die vs. six of them.
By the fourth roll, it becomes more than 999 trillion times more likely that you were rolling one die vs. six of them. By roll #4, if you still think that you were rolling six dice vs. one die, then you would need to visit your health care professional in order to have your head checked out to see if there is anything amiss with your brain.
By roll #30 (very bottom right), there is simply no way to explain the “probability disparity” that has developed. I’m not sure that science has a name for the number, or whether there has ever been an instance (e.g., # of atoms in known universe) where a number that large has ever been needed for anything. Here is the Likelihood Ratio:
528,065,211,594,159,000,000,000,000,000,000,000,000,000,000,000,000,000,000,000,000,000,000,000,000,000,000,000,000,000,000,000,000,000,000,000,000,000,000
Possible application: It may prove interesting to discover the Likelihood Ratio (strength of evidence) regarding known evidence with regard to the COVID shots and the subsequent adverse event reports.
Reference
[Likelihood Ratios for forensics] — The Evaluation of Forensic DNA Evidence. https://www.ncbi.nlm.nih.gov/books/NBK232615/
[statistical issues with paternity testing] — Lee JC, Tsai LC, Chu PC, Lin YY, Lin CY, Huang TY, Yu YJ, Linacre A, Hsieh HM. The risk of false inclusion of a relative in parentage testing - an in silico population study. Croat Med J. 2013 Jun;54(3):257-62. doi: 10.3325/cmj.2013.54.257. PMID: 23771756; PMCID: PMC3692333. https://www.ncbi.nlm.nih.gov/pmc/articles/PMC3692333/