**Previous work on this research question can be found here.
When you test people for influenza, you almost always find out that a minimum of 1 in every 200 people (0.5%) will test positive for flu — showing that the flu never “goes away” but instead is always with us, residing inside of us like bacteria also does.
Fun Fact:
A human being consists of about 30 trillion human cells, and about 38 trillion bacterial cells that reside on your skin and inside of your body, such as in your intestines. The number of bacterial cells is 27% higher than the number of human cells. If cell counts counted, then you would be considered to be “mostly” bacteria.
But if we are walking around with “some” flu inside of us all year, then how come we are not sick all year? How come there are very specific “flu seasons” when a larger proportion of us falls ill?
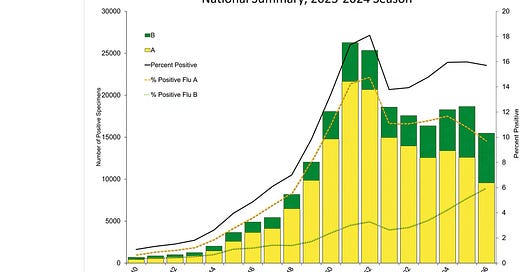
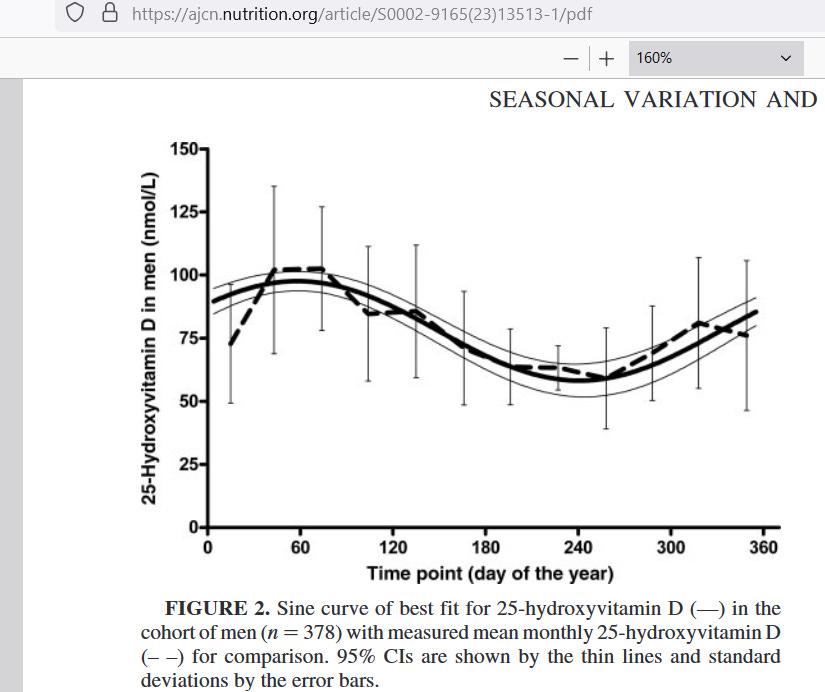
Spoiler: Sun exposure on your skin in summer creates more vitamin D in you (up to 75% more vitamin D than you have in winter). In the image below, the percentage of samples testing positive is marked on the right axis:
In Week 40 of 2023 — the week ending on 7 Oct 2023 — 1% of samples tested positive for flu. In Week 52 of 2023 — week ending on 30 Dec 2023 — 18% of samples tested positive for flu. Due to differences in sunlight exposure, vitamin D levels in the first week of October could be as much as 35% higher than in the last week of December.
This large difference in vitamin D can explain why 18 times as many people tested positive for flu at the end of December compared to the first week of October.
Positivity vs. Illness
Just like the case with bacteria, testing positive for something doesn’t govern whether you become ill or not. What it is that governs whether you become ill or not, more than any other single substance, is your level of vitamin D.
While many things matter to human health (more than you can even count), when each is viewed alone (head-to-head comparisons only), then nothing matters as much as vitamin D. Here is a graphic to help you predict flu outbreaks/epidemics:
In the top row, both the “sender” of flu virus (top left) and the “recipient” (top right) had high levels of vitamin D. In such a case, the viral titer (concentration) in the sender stays low, so that the minimum infective dose isn’t passed along:
At three days post-inoculation (3 dpi) with a lethal dose of H1N1 flu, mice that were low in vitamin D had 10 times as much flu virus in their lung tissue (far left bar) as the mice who had good levels of vitamin D. The scale is log10, so that, moving up by 1 unit — like is shown — means that the number grew by 10-fold.
Log10 values in common numbers:
Mice who were low in vitamin D had about 32 million plaque-forming units (PFU) per gram of lung tissue, while mice high in D only had about 3.2 million PFU/g — even though both groups had been given the same lethal dose of H1N1 flu.
If you are walking around with 10 times as much flu virus in you, then you will be a “better spreader” of flu than other people will, sometimes referred to as a “super-spreader.” This phenomenon of some people being ‘better spreaders’ (largely because their personal vitamin D levels are low) explains why flu’s serial interval is unknown.
In a well-characterized communicable disease, scientists should be able to give you a precise number on the serial interval — the time between successive cases. But even though flu has been around for eons, scientists are still not able to give you a precise number. The existence of ‘better spreaders’ in relation to D levels explains why.
If you do not check D levels before attempting to compute a serial interval, then your numbers will be all over the place. Scientists have been making that mistake for more than 100 years now. It’s important to understand the link between D and infections.
But recent circumstantial evidence — wherein one of the premier societies, The Endocrine Society, stopped recommending high vitamin D (and even advised to stop general testing for it!) — indicates that scientists “plan on” continuing to make that mistake (i.e., let’s all agree not to talk about the elephant in the room).
They “plan to” attempt to continue to ignore the link between infections and vitamin D. This is akin to doctors refusing to acknowledge a link of smoking to lung cancer. It’s the same greed-based, willful ignorance of a knowable fact — or the possibility of being duped by others who are consumed by that greed and who conned you with data.
By the third row of the diagram, you have some spread of flu virus from sender to receiver, but you do not have the propagation of illness (because the receiver was high in vitamin D). You need to be low in D for a flu infection to be able to harm you.
Even looking at those who died of COVID reveals that low vitamin D status was associated with 11.27 times the risk of death:
If being low in D makes you have 10 times the amount of virus in you, and if it makes you have 10 times the capability of spreading the virus to others, and if it also makes you 10 times as likely to have morbidity associated with having the virus in the first place, then it pays to be concerned about your vitamin D levels.
This makes the recent recommendation of The Endocrine Society all the more dumb-founding. Why would they advise us against general testing of vitamin D levels, after having first been such stalwart champions of high vitamin D?
Reference
[mice with low D had 10x the amount of flu in their lungs] — Hayashi H, Okamatsu M, Ogasawara H, Tsugawa N, Isoda N, Matsuno K, Sakoda Y. Oral Supplementation of the Vitamin D Metabolite 25(OH)D3 Against Influenza Virus Infection in Mice. Nutrients. 2020 Jul 5;12(7):2000. doi: 10.3390/nu12072000. PMID: 32635656; PMCID: PMC7400405. https://www.ncbi.nlm.nih.gov/pmc/articles/PMC7400405/
[people with low D were 11.27x more likely to die of COVID] — Radujkovic A, Hippchen T, Tiwari-Heckler S, Dreher S, Boxberger M, Merle U. Vitamin D Deficiency and Outcome of COVID-19 Patients. Nutrients. 2020 Sep 10;12(9):2757. doi: 10.3390/nu12092757. PMID: 32927735; PMCID: PMC7551780. https://www.ncbi.nlm.nih.gov/pmc/articles/PMC7551780/
[men in New Zealand had 74% more vitamin D in the summer] — Bolland MJ, Grey AB, Ames RW, Mason BH, Horne AM, Gamble GD, Reid IR. The effects of seasonal variation of 25-hydroxyvitamin D and fat mass on a diagnosis of vitamin D sufficiency. Am J Clin Nutr. 2007 Oct;86(4):959-64. doi: 10.1093/ajcn/86.4.959. PMID: 17921371. https://ajcn.nutrition.org/article/S0002-9165(23)13513-1/pdf


