

Working-Age Excess Deaths in 2021
Working-Age Excess Deaths in 2021
Post #871

In this prior post, it was shown that natural infection with COVID gave you 95% protection against re-infection for 20 straight months. This means that, if it requires more than 1 infection per year to explain excess death by way of COVID, then the explanation breaks down (you cannot explain such excess deaths by way of COVID).
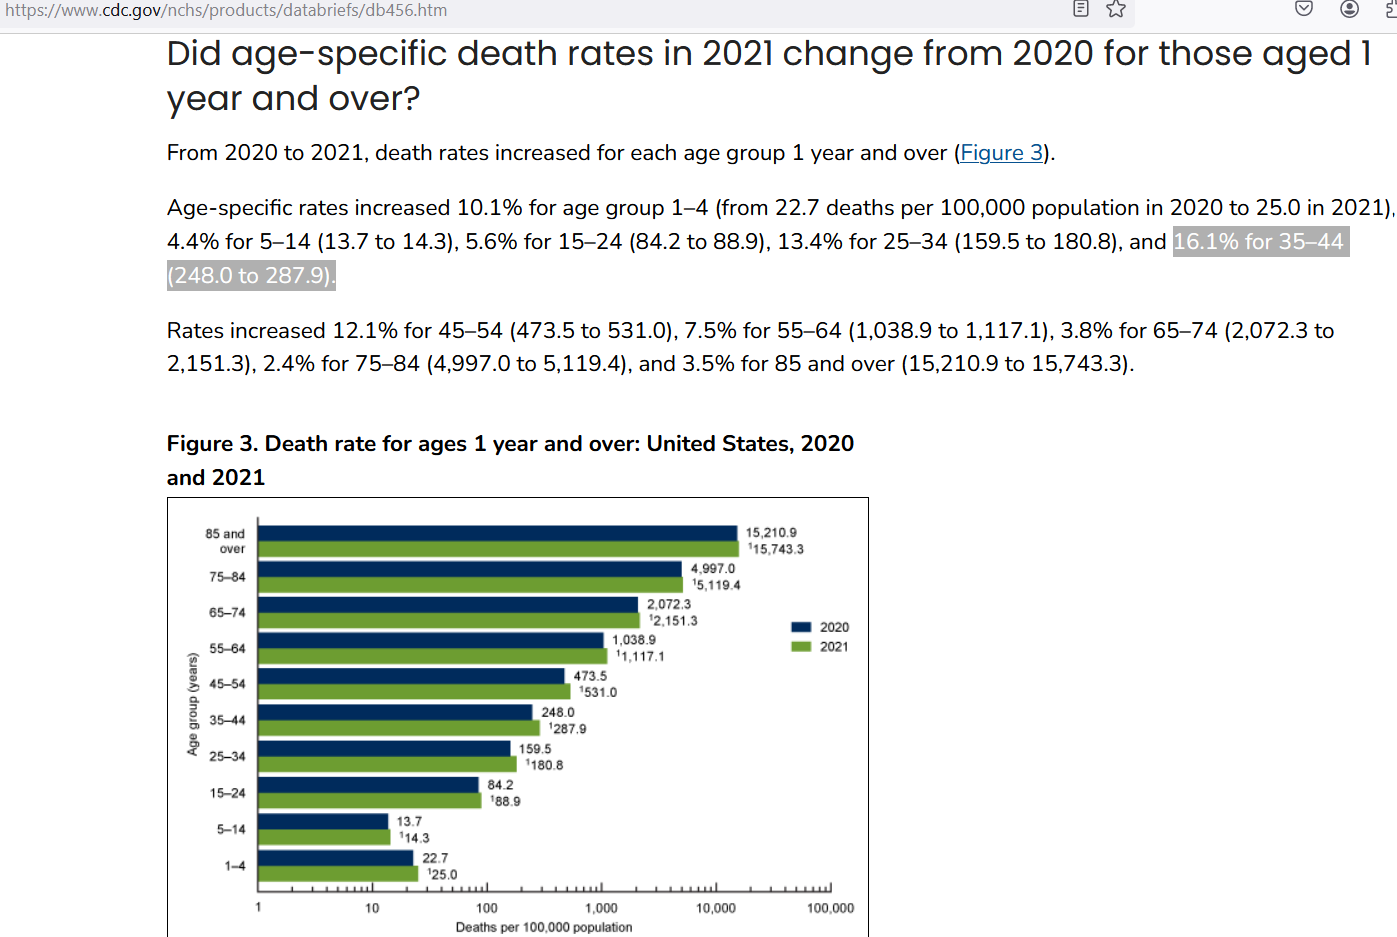
CDC reported that age-specific death rates in 2021 had increased beyond the 2020 death rates by a whopping 16% in those in the 35-44 age group:
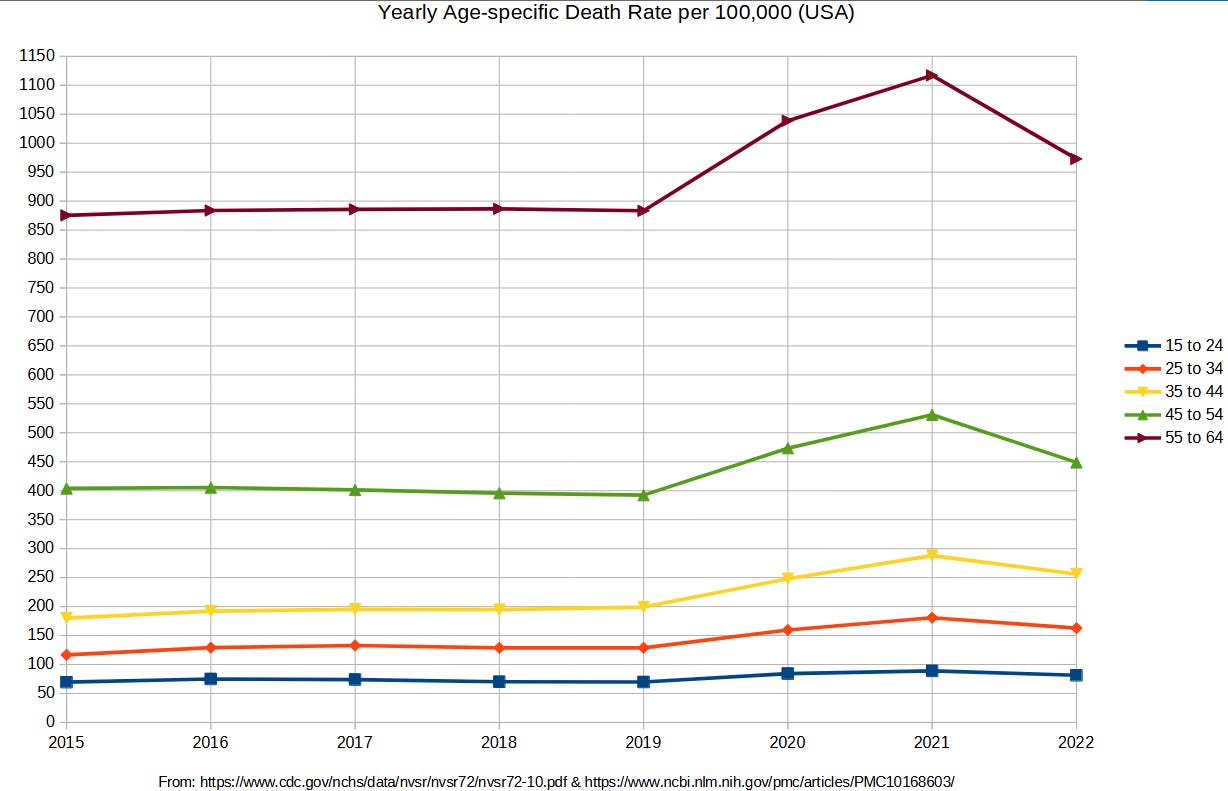
Here is how the change in working-age death rates look when viewed in perspective (age 35-44 group in yellow):
When attempting to explain a 16% increase in death rates from one year to the next, you could develop a likelihood ratio on possible causes for the increase. A conservative threshold is where one cause becomes a million times more likely to be the culprit than another cause.
When DNA is left at a crime scene, juries tend to convict if it can be shown that the suspect is one million times more likely to have left the DNA there than a random passerby would have been. Two competing explanations for the excess death during 2021 are the SARS-CoV-2 virus (“COVID infections”) and the COVID shots.
The reason that they both made it into the “short list” for causing excess death is that millions of people got exposed to them — and a putative cause of excess death requires that kind of broad exposure in the community. But is one of them at least a million times more likely to be the cause of the working age excess death in 2021?
From the post linked to at top, the annual attack rate for COVID was 14.2% — meaning that 14.2% of the country was infected with COVID in the first year. For the purpose of conservative analysis, we’ll pretend that they weren’t — i.e., starting off on 1 Jan 2021 with a U.S. population that is still 100% susceptible to COVID.
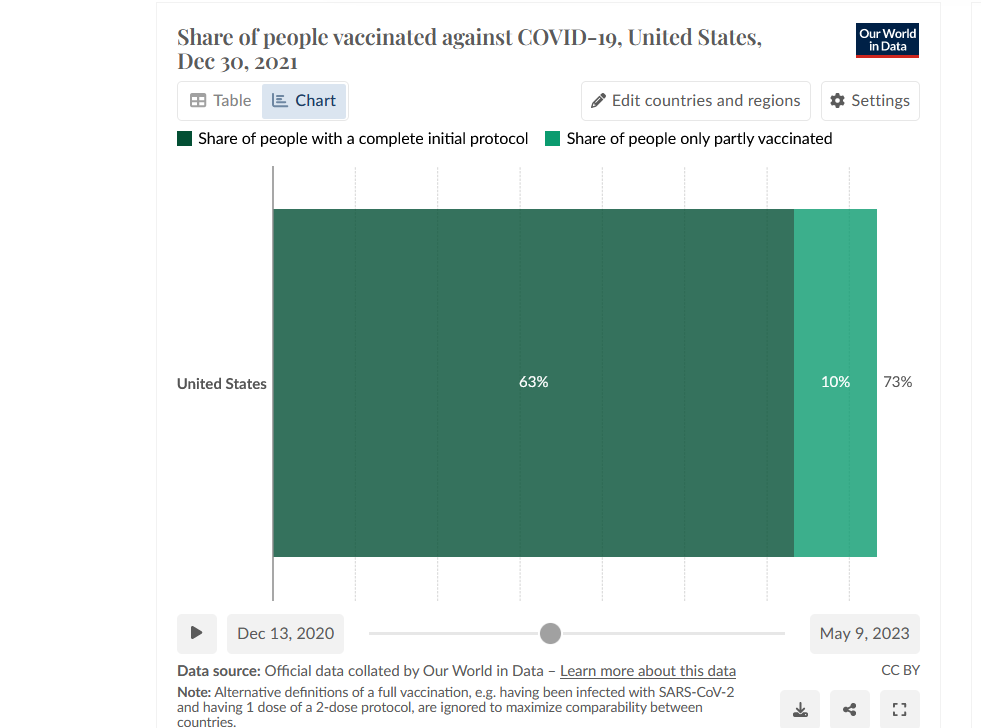
The number of COVID shots by age group was only roughly estimated using the overall rate as a benchmark:
NOTE: Booster shots are ignored, making the comparison even more conservative
By 30 Dec 2021, 63% of people had received at least two shots, and another 10% of people had received one shot. When 63% receive two shots, that makes for ( 63 * 2 = ) 126 shots per 100 persons. When the other 10% are added in, there are 136 shots per 100. This point estimate was used for the age band of 55-64 (cell F44):
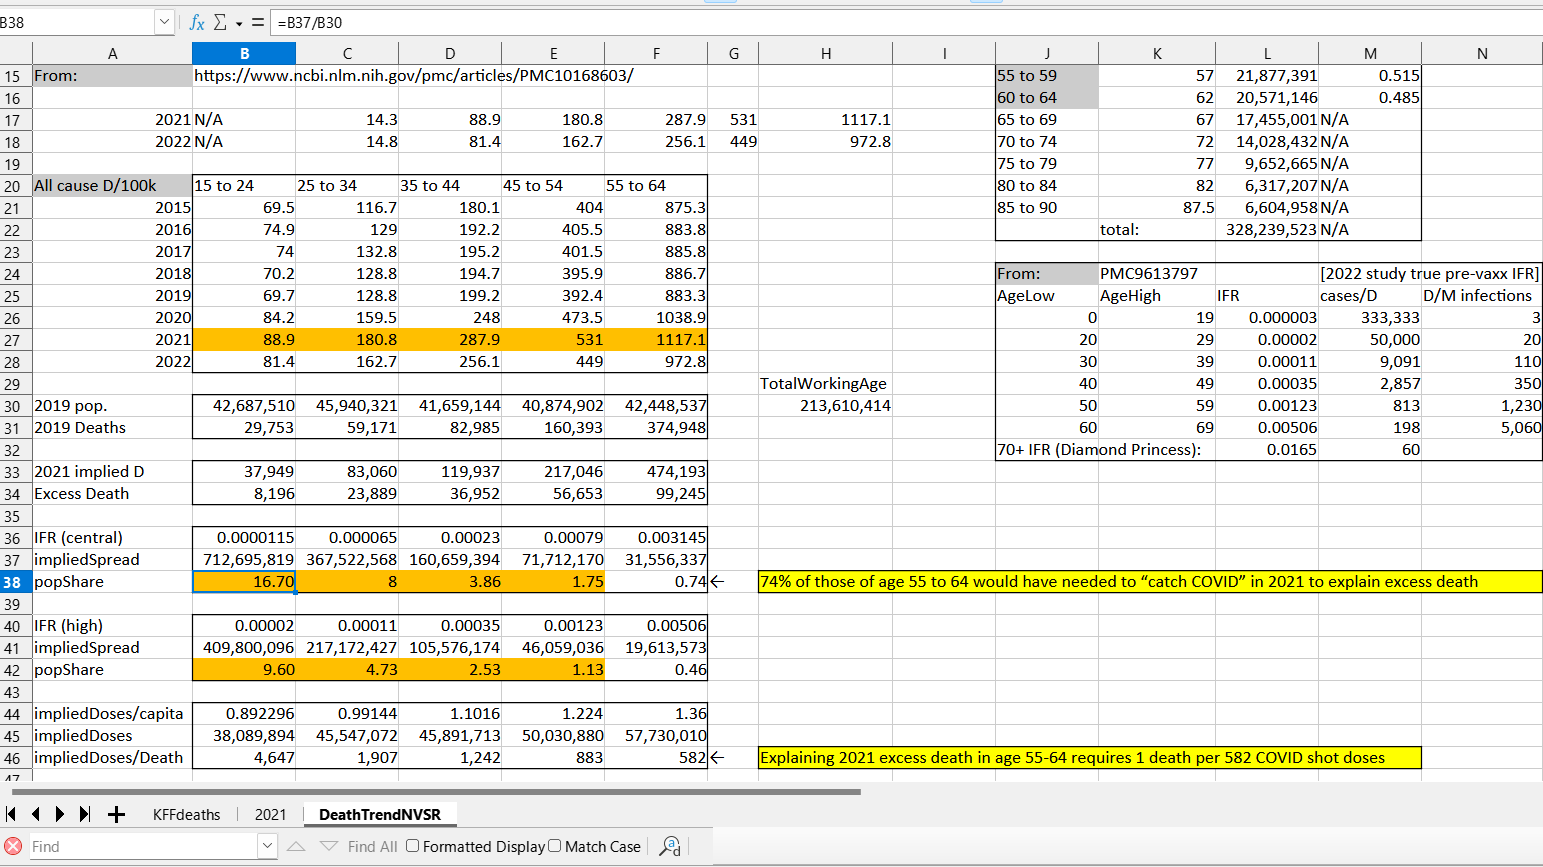
[click to enlarge]
In the younger groups (row 44), the COVID shot uptake was stepped down by 10% each time. The most striking finding was in cell B38, where it is shown that — to explain year 2021 excess deaths in those of age 15-24 by way of COVID — it requires that people in that age band got COVID an average of 16.7 times during 2021.
This would imply over 700 million COVID infections in this group of 43 million.
When using a high estimate of the age-specific infection fatality rate (IFR) — i.e., using the one for age 20-29 when computing results for age 15-24 — it was still required that the average number of COVID infections during 2021 was 9.6 in the youngest age band (410 million COVID infections in 43 million people in one year).
The IFR for age 20-29 is equivalent to 20 deaths per million infections.
By contrast, to explain the 8,196 excess deaths in this age band in 2021 by way of COVID shot fatal adverse events would require a fatality for every 4,647 COVID shots administered to this youngest age group. Fraiman et al. found one hospitalization for a serious adverse event for every 1,600 mRNA shot doses given out.
If 34% of those hospitalizations after COVID shots were fatal, then it’d explain 100% of the excess death in 2021 for this age group. More importantly, because 9.6 yearly infections is essentially impossible, given 20 months of 95% protection from a natural infection, the COVID shot is the likely cause.
The only age group still in question
This finding is true for every age band below age 55 — it is impossible that COVID caused their excess deaths, because it requires “too many infections” to occur inside of 12 months of time. Even for those of age 55-64, when the central estimate on COVID IFR is applied, it is required that 74% of them “develop COVID” in 2021.
Using the high estimate of IFR — the one that applies to those of age 60-69 — brings the spread of infection into the realm of possibility, where a 46% spread of infection in 2021 in that age band could have been able to explain their excess death in 2021. But U.S. seroprevalence data from Apr-Jun 2021 (left) make that much spread unlikely:
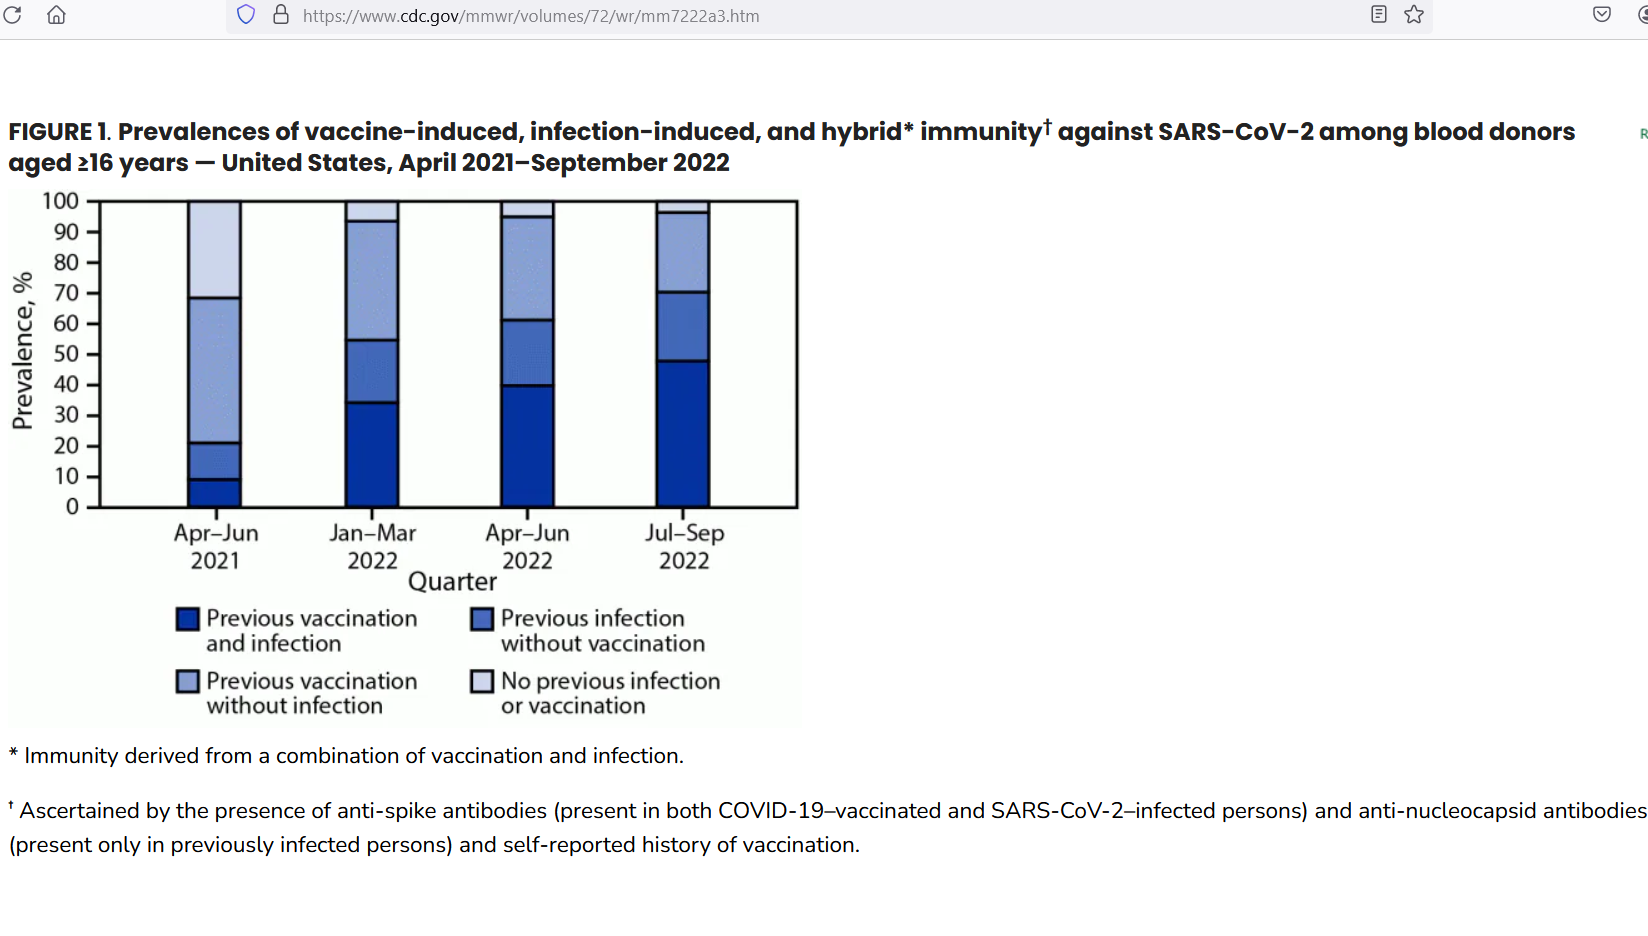
The spread of COVID infection in the USA had reached 20.9% by June 2021 — providing 20 months of 95% protection from reinfection. This makes it extremely unlikely that new infections could reach 46% during 2021, as that would require total infections to “quadruple” during 2021 — from a 2020 baseline value of 14.2% spread.
And almost all of that quadrupling would have had to have occurred after June 2021. If 46% COVID spread was required to happen in this age group “during 2021” — but the grand total of all COVID infections never even reached 30% by Dec 2021 (below), then it is impossible for COVID to explain their excess deaths in 2021.
And check out how flat the growth of infection-induced seroprevalence was from Sep 2021 to Dec 2021:
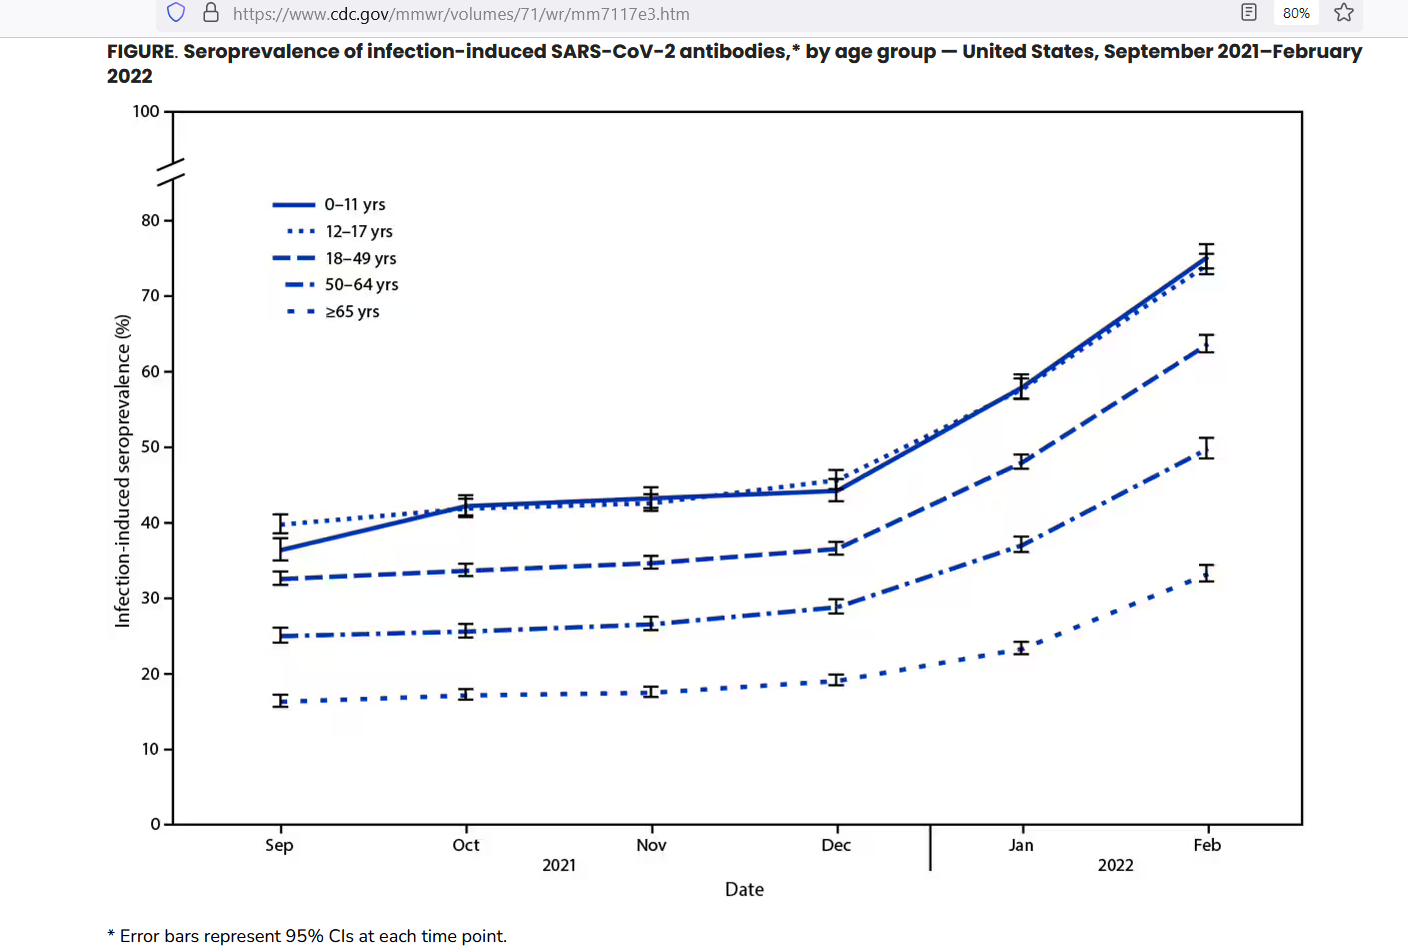
The sum total of all infection prevalence for older groups is below 30% by Dec 2021
Age groups would be lucky if they were able to add 5% to their accumulated prevalence of COVID infections from Sep 2021 to Dec 2021. No group was able to add 10% to their COVID prevalence. Disregarding total spread, even trend data make it extremely unlike that COVID caused the excess deaths in the 55-64 age group in 2021.
Here is a pull-quote from the CDC article:
“During September–December 2021, overall seroprevalence increased by 0.9–1.9 percentage points per 4-week period.”
You can’t add 46% inside of 12 months of time when you are only adding infections at a top-estimated rate of 1.9% per month.
In contrast, in order to explain their excess death by way of COVID shots alone would require one fatality for every 582 COVID shots. For all of the excess deaths that occurred in age bands below age 55, it is at least a million times more likely that the excess death was caused by the COVID shots than that it was caused by COVID, itself.
Only for the age band of 55-64 is it plausible that COVID might have been the cause of their excess deaths — but that requires an incidence rate of COVID of 46% in a year (over 3 times the background COVID incidence rate from the phase 3 mRNA trials). Importantly, CDC data do not reveal anything even close to such increased spread.
The more likely explanation is that, like in younger groups, the majority of excess deaths in the 55-64 age band in 2021 was also caused by the COVID shots (not by COVID).
Reference
[COVID shot uptake] — OWID. https://ourworldindata.org/covid-vaccinations
[16% increase in “middle-aged” death rate from 2020 to 2021] — CDC. https://www.cdc.gov/nchs/products/databriefs/db456.htm
[2020 National Vital Statistics Report] — CDC. https://www.cdc.gov/nchs/data/nvsr/nvsr72/nvsr72-10.pdf
[2021 and 2022 death rates by age band] — Ahmad FB, Cisewski JA, Xu J, Anderson RN. Provisional Mortality Data - United States, 2022. MMWR Morb Mortal Wkly Rep. 2023 May 5;72(18):488-492. doi: 10.15585/mmwr.mm7218a3. PMID: 37141156; PMCID: PMC10168603. https://www.ncbi.nlm.nih.gov/pmc/articles/PMC10168603/
[age-specific COVID infection fatality rates (IFR) prior to COVID shots] — Pezzullo AM, Axfors C, Contopoulos-Ioannidis DG, Apostolatos A, Ioannidis JPA. Age-stratified infection fatality rate of COVID-19 in the non-elderly population. Environ Res. 2023 Jan 1;216(Pt 3):114655. doi: 10.1016/j.envres.2022.114655. Epub 2022 Oct 28. PMID: 36341800; PMCID: PMC9613797. https://www.ncbi.nlm.nih.gov/pmc/articles/PMC9613797/
[COVID spread by June 2021] — Estimates of SARS-CoV-2 Seroprevalence and Incidence of Primary SARS-CoV-2 Infections Among Blood Donors, by COVID-19 Vaccination Status — United States, April 2021–September 2022. Weekly / June 2, 2023 / 72(22);601–605. https://www.cdc.gov/mmwr/volumes/72/wr/mm7222a3.htm
[increase in COVID spread, late 2021] — Seroprevalence of Infection-Induced SARS-CoV-2 Antibodies — United States, September 2021–February 2022. Weekly / April 29, 2022 / 71(17);606-608. On April 26, 2022, this report was posted online as an MMWR Early Release. https://www.cdc.gov/mmwr/volumes/71/wr/mm7117e3.htm
“During September–December 2021, overall seroprevalence increased by 0.9–1.9 percentage points per 4-week period.”
[one hospitalization for serious adverse event for every 1,600 doses given] — Fraiman J, Erviti J, Jones M, Greenland S, Whelan P, Kaplan RM, Doshi P. Serious adverse events of special interest following mRNA COVID-19 vaccination in randomized trials in adults. Vaccine. 2022 Sep 22;40(40):5798-5805. doi: 10.1016/j.vaccine.2022.08.036. Epub 2022 Aug 31. PMID: 36055877; PMCID: PMC9428332. https://www.ncbi.nlm.nih.gov/pmc/articles/PMC9428332/