

2021 Mortality Much Worse than 2020
2021 Mortality Much Worse than 2020
40-Nation Comparison across both years

In a bad year of flu, such as seen in the 2017/18 flu season, the pneumonia & influenza (P&I) yearly deaths per million can reach 600. If two bad flu seasons were back-to-back, then the cumulative P&I deaths per million would reach 1200 deaths per million.
In the 20 locations in the graph below, two years of COVID didn’t result in even 900 excess deaths for any single location, and the average of all 20 was just 106 excess deaths over two-years of time.
Two bad years of flu would be 12 times worse than COVID was, in those particular locations.

But these “lucky 20 nations” are contrasted against an “unlucky 20 nations” where average excess deaths per million were so high that they reached 38% of Holocaust-level death rates.
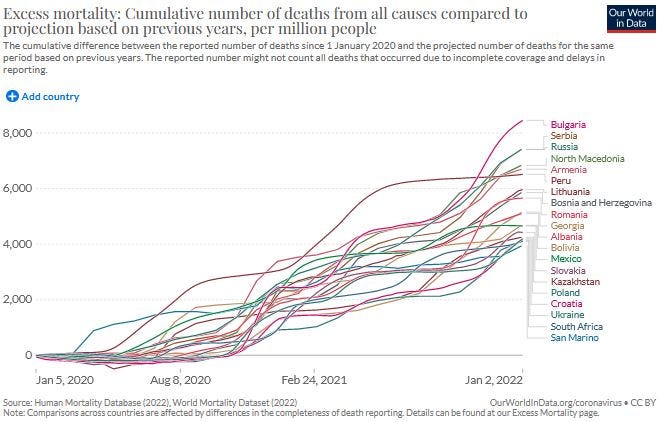
The contrast is even more striking when viewing all 40 locations together in one graph:

Most disturbingly, the year of 2021 — which included exposure to less-lethal COVID variants, but also to vaccines — led to 74% more excess death than the year of 2020, when no vaccines were available.
A crude interpretation of that finding is that vaccines make you at least 74% more likely to die.
Here is a bar chart showing the 20-nation average excess death per million for 2020 in each group, along with the nation with the highest excess death per million in 2020. At right is a bar representing the yearly P&I death rate seen from a bad year of flu, added for perspective.
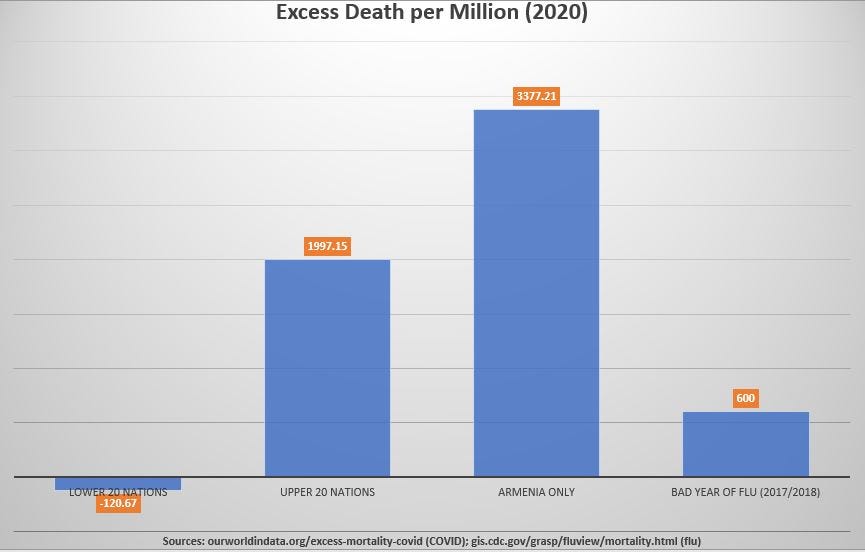
As you can see, there were no average excess deaths in the first group of 20, but average excess deaths per million in the other group was more than 3 times higher than what is expected in a bad year of flu.
Excess deaths in Armenia were more than 5 times higher than a bad year of flu.
But 2021 is when the excess deaths took off like a rocket, even in the group of 20 locations which had the lowest average excess death. Because a bad year of flu was no longer high enough to provide perspective on excess deaths in 2021, the average annual kill rate of the Holocaust was added at right.
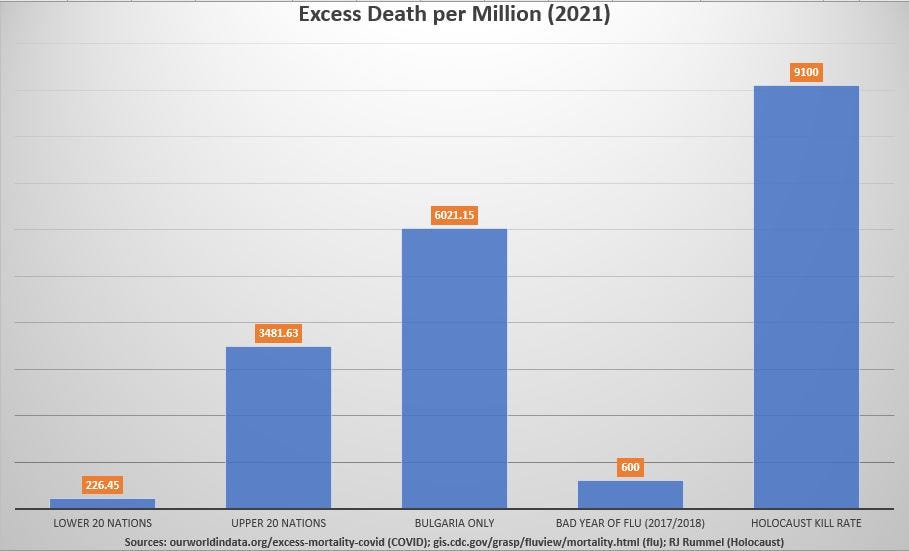
As you can tell, the year when vaccine coverage vastly expanded (2021) was over 15 times worse in the group of 20 locations which had the highest average excess death — compared to the lowest 20.
The ‘upper-20’ average excess death in 2021 was 74% higher than in 2020 — compared to itself.
Excess death in Bulgaria during the year of expanded coverage with COVID vaccines was a full two-thirds of the Holocaust kill rate, and over 10 times more excess death than is expected in a bad year of flu.
When samples of nations are averaged, and those averages are compared to other samples, you’d expect for there to be some difference due to variability. Some nations have a more elderly population. Some have poor healthcare systems.
When all is said and done, the average of excess death from acute respiratory disease in one sample of nations can be almost 5 times more than the average of another sample — i.e., a large difference in average excess death from an acute respiratory disease.
This final graph adds that maximum expected difference in average excess death rate from any two samples comprised of groups of different nations:

To obtain the maximum expected difference in average excess death for any two groups of nations, using countries representing 57% of the entire world, I picked the highest 16 nations and also the lowest 16 nations from a sample of 33 nations reporting their baseline flu excess death rates for the age-bracket of 65 to 74.
The highest 16 values had an average which was 4.8 times as large as the lowest 16 values — an almost 5-fold difference when comparing top and bottom means.
But in the worst 20 nations with data available during COVID, their average excess death rate was over 15 times higher than the average of the lowest 20 nations.
This indicates that the higher death rate wasn’t caused by natural causes, such as by infectious disease. An artificial cause can lead to mean death rates over 15 times higher in groups as large as n=20, but all indications are that natural causes cannot.
In groups as large as n=20, only about a 5-fold difference in death rates is expected, as found when deliberately grouping the lowest death rates together in one sample, and the highest death rates together in the other.
Evidence suggests that the super-high death rate of 2021 is from an artificial cause, the most-likely candidate being the COVID vaccine (the biggest change of 2021).
Reference
[Cumulative Excess Death per million] — OWID data. Available: https://ourworldindata.org/excess-mortality-covid
[2017/18 Weekly P&I deaths] — CDC “FluView” online tool. Available: https://gis.cdc.gov/grasp/fluview/mortality.html
[Annualized 0.91% kill rate of Holocaust (Germany + Occupied Europe)] — DEMOCIDE: NAZI GENOCIDE AND MASS MURDER. 20,946,000 Victims: Nazi Germany 1933 To 1945. By R.J. Rummel. Available: https://hawaii.edu/powerkills/NAZIS.CHAP1.HTM
[As of 19 Jan 2021, from 52,000 COVID infections with Alpha (SGTF) variant, there were 104 deaths (IFR=0.2%)] — UK Technical Briefing #5 (PDF file). Available general: https://www.gov.uk/government/publications/investigation-of-novel-sars-cov-2-variant-variant-of-concern-20201201
Available specific page: https://assets.publishing.service.gov.uk/government/uploads/system/uploads/attachment_data/file/959426/Variant_of_Concern_VOC_202012_01_Technical_Briefing_5.pdf
[In almost 700,000 cases confirmed by sequencing, Delta was 42% as lethal as Alpha (IFR=0.08%)] — UK Technical Briefing #25. Available general: https://www.gov.uk/government/publications/investigation-of-sars-cov-2-variants-technical-briefings
Available specific page: https://assets.publishing.service.gov.uk/government/uploads/system/uploads/attachment_data/file/1025827/Technical_Briefing_25.pdf
[From 1.5 million confirmed cases, Omicron is (at most) 41% as lethal as Delta (IFR = 0.034%)] — Nyberg T, Ferguson NM, Nash SG, Webster HH, Flaxman S, Andrews N, Hinsley W, Bernal JL, Kall M, Bhatt S, Blomquist P, Zaidi A, Volz E, Aziz NA, Harman K, Funk S, Abbott S; COVID-19 Genomics UK (COG-UK) consortium, Hope R, Charlett A, Chand M, Ghani AC, Seaman SR, Dabrera G, De Angelis D, Presanis AM, Thelwall S. Comparative analysis of the risks of hospitalisation and death associated with SARS-CoV-2 omicron (B.1.1.529) and delta (B.1.617.2) variants in England: a cohort study. Lancet. 2022 Mar 16:S0140-6736(22)00462-7. doi: 10.1016/S0140-6736(22)00462-7. Epub ahead of print. PMID: 35305296; PMCID: PMC8926413. Available: https://www.ncbi.nlm.nih.gov/pmc/articles/PMC8926413/
[top 16 nations had mean flu excess death rates 4.8 times higher than the mean of the bottom 16 nations (age 65-74 bracket)] — Iuliano AD, Roguski KM, Chang HH, Muscatello DJ, Palekar R, Tempia S, Cohen C, Gran JM, Schanzer D, Cowling BJ, Wu P, Kyncl J, Ang LW, Park M, Redlberger-Fritz M, Yu H, Espenhain L, Krishnan A, Emukule G, van Asten L, Pereira da Silva S, Aungkulanon S, Buchholz U, Widdowson MA, Bresee JS; Global Seasonal Influenza-associated Mortality Collaborator Network. Estimates of global seasonal influenza-associated respiratory mortality: a modelling study. Lancet. 2018 Mar 31;391(10127):1285-1300. doi: 10.1016/S0140-6736(17)33293-2. Epub 2017 Dec 14. Erratum in: Lancet. 2018 Jan 19;: PMID: 29248255; PMCID: PMC5935243. Available: https://www.ncbi.nlm.nih.gov/pmc/articles/PMC5935243/