


29 Unrealistic Monthly Death Rates
Monthly Death Statistics in the UK

Death rates move around a little from one month to the next, reflecting the fact that life isn’t always the same. In the USA from 2014 to 2019, the weekly death rates were joined together into groups of 4 weeks each, in order to approximate a month of death.
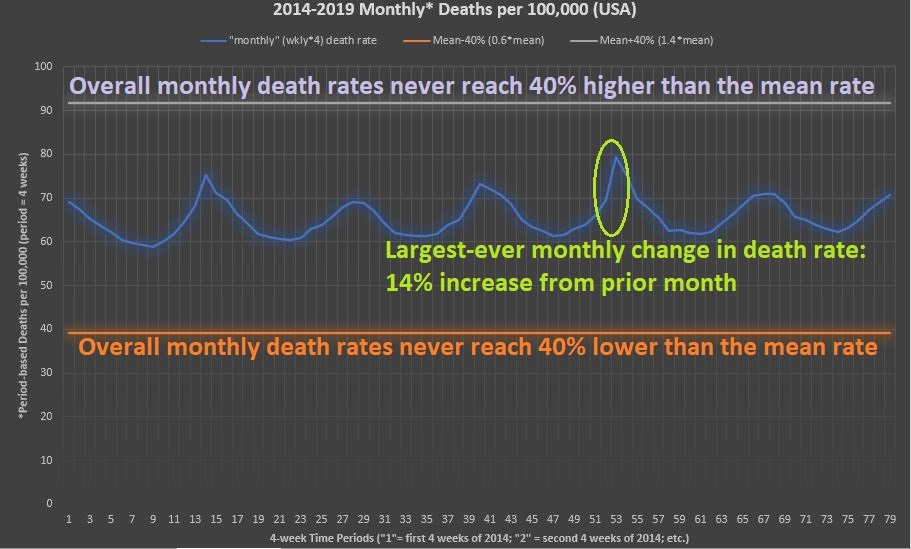
As you can tell from the graph, monthly death in the USA ranges from 60 deaths per 100,000 up to 80 deaths per 100,000 — depending on the season of the year you are in.
The greatest-ever change in adjacent months was early in 2018, when the monthly death rate rose 14% from one month to the next. The total death rate change across all months never even approached a 40% change from the average — i.e., a monthly death rate which was 40% higher than the monthly average death rate.
In the USA in those years, total death rate change across all months never even reached 25% above the mean (or below it). There was never a time, in 79 months in a row, when monthly death was even 25% higher than average.
But that’s overall death rates and the age-specific death rates might fluctuate more. To account for this, I applied a full 50% swing in the average expected monthly death rates for age groups in the UK, using age-specific death rates from the USA in 2016 as a reference point.
Age 40 to 49
The expected annualized death rate for those age 40-49 is 265 yearly deaths per 100,000, and a 50% error margin leads to a realistic low of 132 deaths per 100,000, and a realistic high of 397 deaths per 100,000.
For those of age 40 to 49, deaths outside of that broad range are “unrealistic” — and not expected to ever happen. Remember how much room there was with just even a 40% error margin in the graph for the USA.
This is a 50% error margin.
Even still, would you believe that the annualized January 2021 death rate for the vaccinated in the UK was just 78 per 100,000?
Neither would I, as it is not realistic for 40-49 years to die that rarely.
Maybe if the UK had discovered some kind of a magic elixir could they “truly” have 45-year olds only dying at a paltry rate of 78 per 100,000 — but not without a magic elixir. If they discovered one, as their death data indicates, why not share it with the world?
Age 50 to 59
Moving on to the 50 to 59 year olds, they are expected to die at a rate of 616 per 100,000, with a lower bound of 308 and an upper bound of 924 per 100,000. Yet their January 2021 death rate was only 231 per 100,000 — more than 60% below expectation.
Vaccinated 50-59 year olds must have gotten some of that magic elixir, also.
Perhaps most importantly, these tiny death rates were seen in January, which is one of the deadliest months of the year — if not THE deadliest month of the year.
Age 60 to 69
For those of age 60 to 69, the expected death rate is 1258 per 100,000, with a lower bound of 629 and an upper bound of 1886 deaths per 100,000.
But when unvaccinated persons of age 60 to 69 were followed for 26,000 person-years of observation in April of 2021, 732 of them died — giving a death rate of 2790 per 100,000 person-years.
That’s over twice as high as the expected death rate for that age group, though (a 120% increase).
But wait until you hear about unvaccinated 70-year-olds in the UK.
Age 70 to 79
Expected death rates for those age 70 to 79 are 2886 per 100,000. Knocking 50% off of that gives 1443 per 100,000 — and tacking on an extra 50% to that gives 4329 per 100,000.
But what if I were to tell you that, in February of 2021, their death rate was 12,251 per 100,000 — more than 4 times higher than expected death?
That’s from 5071 February deaths recorded among the unvaccinated in a total of 41,393 person-years of observation.
The death rate for the vaccinated in that month was just 1631 per 100,000 — making it appear as if the COVID vaccines had the uncanny ability to cut all-cause mortality (this time using unvaccinated persons as the baseline) by an astonishing 87%, just like a magic elixir might be able to do.
Reports should stay realistic (no “sham” stats)
All in all, there were 29 instances of age-specific death rates which were so different from average that they’d be unrealistic. Most of them were unrealistically low death rates which could not be possible without something like a magic elixir.
It is more possible to increase death rates than to be able to lower them by so much.
It appears as if the UK officials have deliberately “miscategorized” vaccine deaths on a wide scale, padding the accounts of the unvaccinated, while skimming the accounts of the vaccinated.
This is because the resulting death rates — just like ballot boxes stuffed with more ballots than there are registered voters! — are not realistic death rates. Death rates do change from month to month, but they don’t change by the flagrant amounts shown in UK death stats.
Let’s get real.
Reference
CDC. National Vital Statistics Reports. Deaths: Final Data for 2016. https://www.cdc.gov/nchs/data/nvsr/nvsr67/nvsr67_05.pdf
CDC. National Center for Health Statistics. Weekly Counts of Deaths by State and Select Causes. https://data.cdc.gov/NCHS/Weekly-Counts-of-Deaths-by-State-and-Select-Causes/3yf8-kanr
"Table 2. Monthly age-standardised mortality rates by vaccination status by age group for all cause deaths, deaths involving COVID-19 and deaths not involving COVID-19, per 100,000 person-years, England, deaths occurring between 1 January 2021 and 31 March 2022." Age-standardised mortality rates for deaths by vaccination status, England: deaths occurring between 1 January 2021 and 31 March 2022: 16 May 2022. Age-standardised mortality rates for deaths involving COVID-19 by vaccination status, broken down by age group and sex. Deaths occurring between 1 January 2021 and 31 March 2022 in England. https://www.ons.gov.uk/peoplepopulationandcommunity/birthsdeathsandmarriages/deaths/datasets/deathsbyvaccinationstatusengland