

6 Decades of Mortality Rate Z-scores (USA)
6 Decades of Mortality Rate Z-scores (USA)
Highly-Intuitive Expression of Excess Deaths

As Norman Fenton and Martin Neil show in this Substack, the calculation of excess deaths can be fraught with assumptions. I’ll lengthen the baseline time window here to incorporate some of the concerns, and avoid using the year of 2020 in any baseline.
In order to capture the pandemic flu year of 1957, a 7-year baseline was used here — instead of the 10-year baseline suggested by Fenton & Neil. Other research (cited below) reveals that 7 years of data can be ample.
One of the most intuitive expressions of excess death in a year would compare it to an average of prior years, but standardized to the standard deviation of those prior years.
This standard score is a Z-score, and it takes account of the direction of change, the magnitude of change, and the inherent (background) variability in a given measure of change.
When the Z-score is zero, the crude mortality rate in a given year is the same as the mean of the prior 7 years. When the Z-score is 1.0, the crude mortality rate in a given year is one standard deviation above the mean of the prior 7 years.
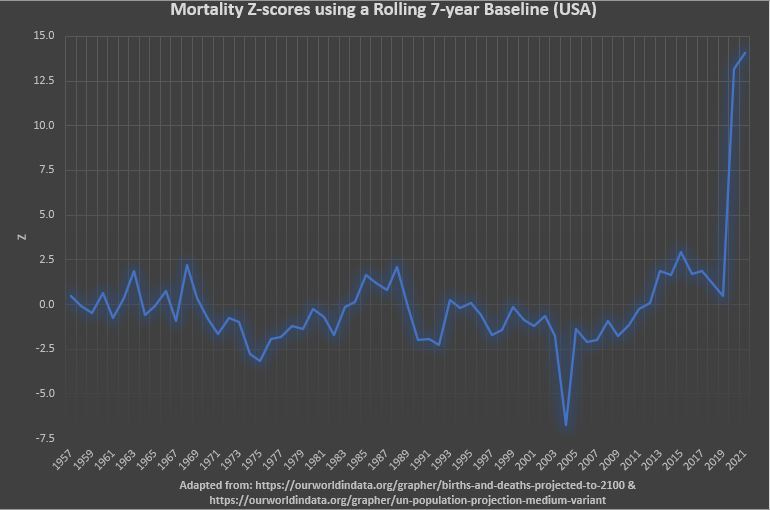
The steep drop in 2004 was an artifact of the abnormally-consistent crude mortality rate from 1997 to 2003 (the 7 years prior to 2004). Because the standard deviation in the annual mortality rate for those years was only 4.5 per 100,000, then any small deviation from the mean would show up as a large-magnitude Z score.
This chart includes the pandemic flu of 1957 and the pandemic flu of 1968, though neither pandemic led to mortality rates 2.5 standard deviations above the mean of the prior 7 years.
In fact, for almost 60 years in a row, the mortality rate Z-score never hit 2.5. It was only after legislation (Affordable Care Act) was enacted, giving the U.S. government unprecedented control over the provision of health care, that the mortality rate Z-score passed 2.5 (in the year of 2015).
The mortality rate Z-score of 2021 was calculated from a 2013-2019 baseline (as was 2020), and it was an appalling 14.1 standard deviations above the mean — the highest value in 65 years.
Using Z-scores, the excess mortality of 2021 was so high that it was “worth” over 5 pandemics of flu — but COVID was never even close to being 5 times more fatal than pandemic flu. This suggests that, in 2021, something besides COVID was leading to the excess deaths.
Reference
[in every 7-year time window, at least two non-epidemic years are found] — Shkolnikov VM, Klimkin I, McKee M, Jdanov DA, Alustiza-Galarza A, Németh L, Timonin SA, Nepomuceno MR, Andreev EM, Leon DA. What should be the baseline when calculating excess mortality? New approaches suggest that we have underestimated the impact of the COVID-19 pandemic and previous winter peaks. SSM Popul Health. 2022 Jun;18:101118. doi: 10.1016/j.ssmph.2022.101118. Epub 2022 May 6. PMID: 35573866; PMCID: PMC9075981. https://www.ncbi.nlm.nih.gov/pmc/articles/PMC9075981/