

700 Deaths per Million Shots?
700 Deaths per Million Shots?
Trend analysis of Spring/Summer 2022

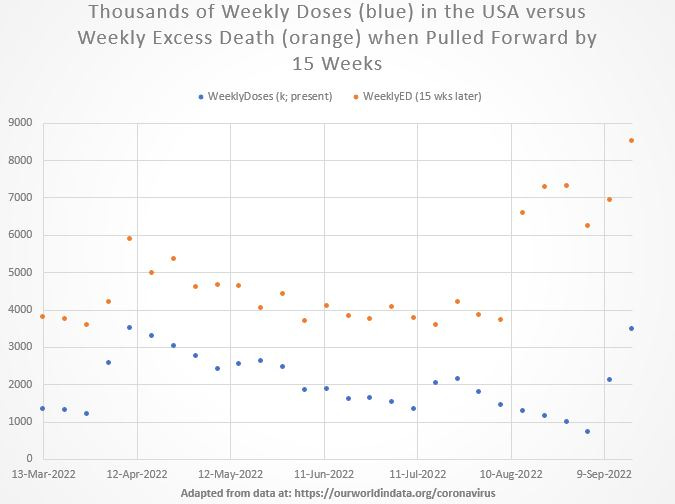
In this prior Substack, you can tell that weekly excess deaths tracked too closely with weekly booster jab rates 15 weeks prior. Here is the image again:
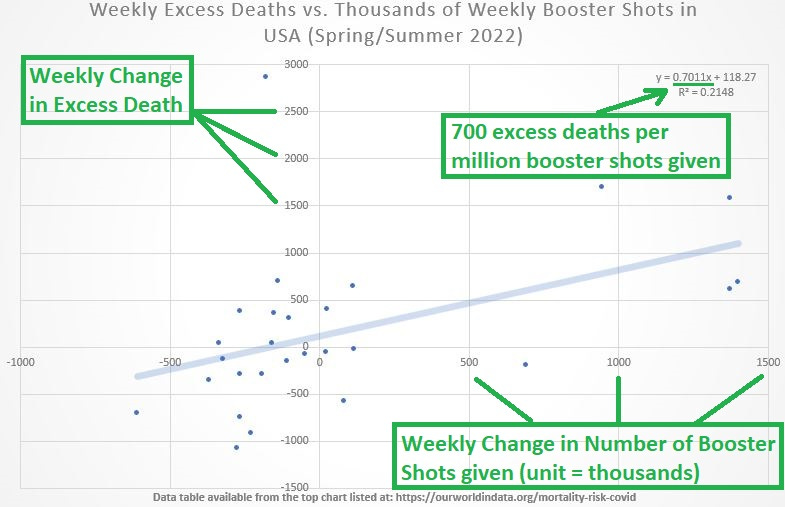
And the weekly change seen in each variable shows significant correlation:
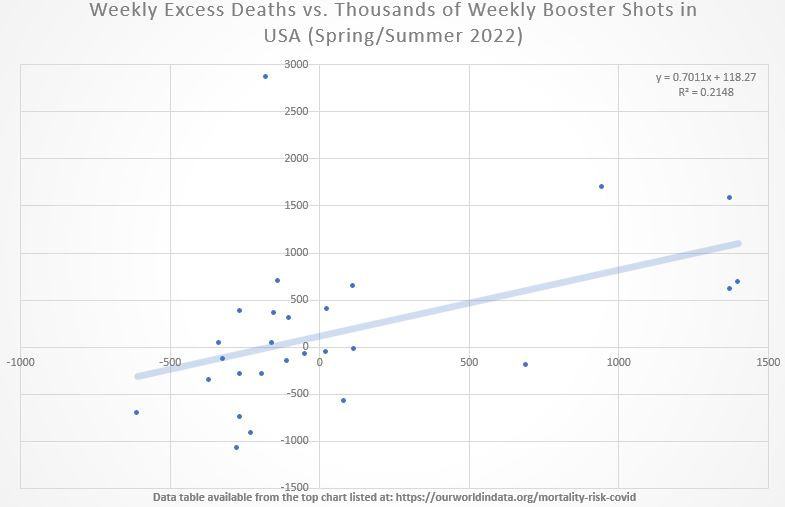
The estimated excess death linked to boosters is about 700 per million shots given:
Also of note is that the postulated 700 deaths which are linked to every million jabs are only those occurring precisely 15 weeks post-dose, and that other deaths may also be linked to COVID jabs in a statistically-significant way (like these 15-week deaths are).
This means that it remains possible that COVID jabs cause over 1,000 deaths per million jabs.
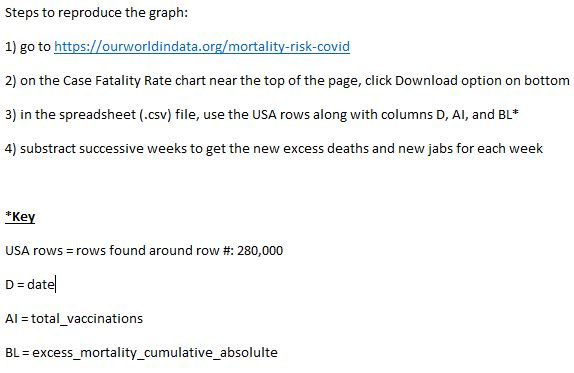
And to recreate the graph (using the data attached to the top graph at: https://ourworldindata.org/mortality-risk-covid), here are steps:
Technical Note: Jab data are given for every day of the week, but excess death is only given for one date each week. To sort the entire data so that only the same day each week shows, use the =Weekday function on the daily dates (in an adjacent column). This puts a (1-7) number for each day of the week, so that you can sort data by that day of the week — to directly compare to the corresponding excess death date each week.