

76% more COVID death in the Middle-aged?
76% more COVID death in the Middle-aged?
Red Flag: Vaccines aren't supposed to have THAT kind of an effect

Red flags keep popping up regarding the changes in deaths seen when moving from 2020 to 2021 — and even now into 2022.
Here is a graph showing COVID deaths in those of age 45 to 54 from March to December of 2020 (before vaccines) and then for the same time period after vaccines had rolled out (January to October 2021):
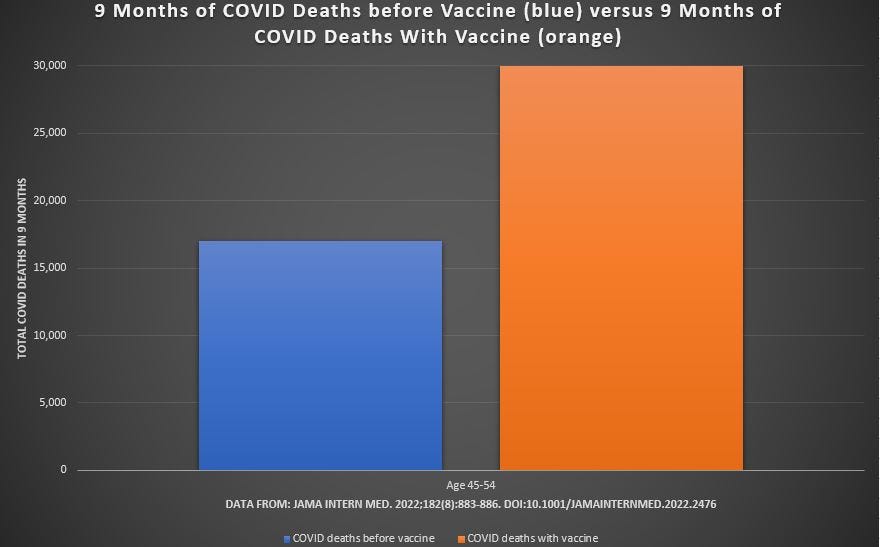
The researchers who reported these “similar time-window” death counts suggested that the reason for excess death (orange) may be due to low vaccination rates.
But the problem with such reasoning is that the reason for excess death beyond what the disease itself had been causing (blue) can be explained by any meaningful uptake level of something experimental.
After millions take something, it doesn’t really matter if those millions represented 10% or 90% of the population of interest. The fact is that millions took something new — and a big change in death occurred.
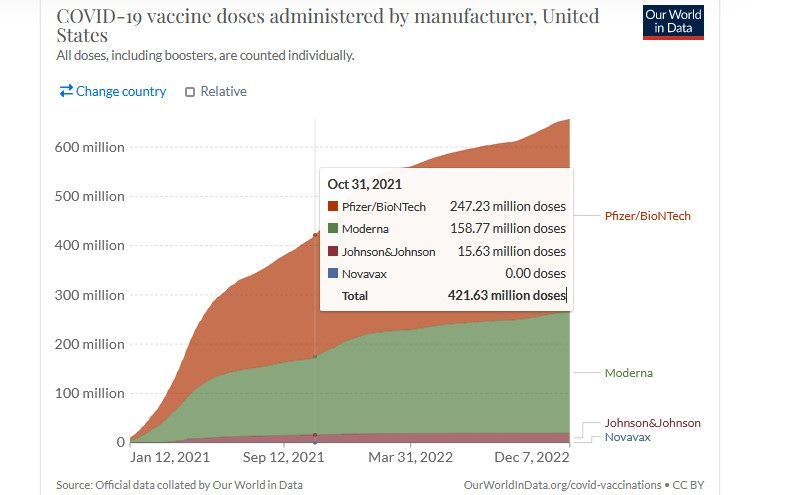
By the end of the time window for the deaths represented by the orange bar, over 400 million doses had been administered:
Also of interest is the recent change in various natural cause deaths. Deaths by natural causes are typically from chronic disease such as heart disease and kidney disease, etc. The rate of annual change in deaths by natural causes is somewhat predictable:

When the standard deviation of natural cause deaths is divided by the mean of those deaths, it is found that that standard deviation represents approximately 3% of the mean value (cell B16 above).
When the annual change in a particular natural cause death is tabulated, it is typically found to be one standard deviation or less. This implies that the expected annual change that is seen will tend to be about 3% or maybe 4% from one year to the next.
But look at these annual changes of 7% or more:
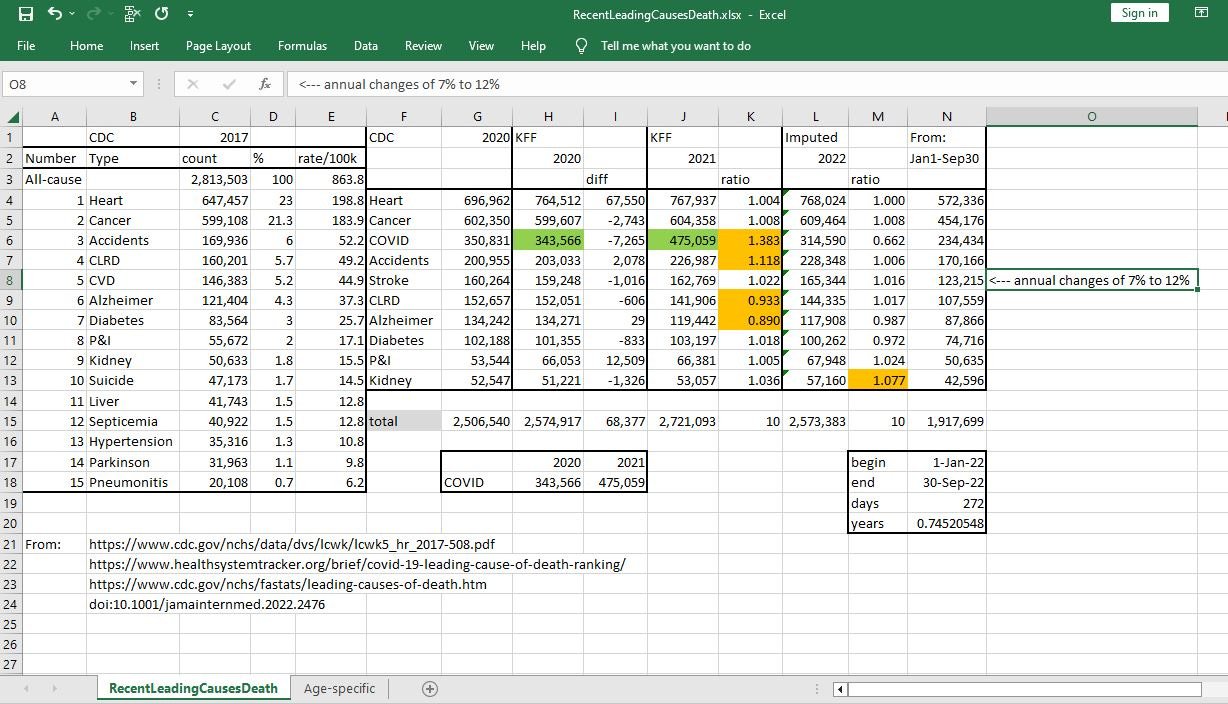
Overall COVID death increased by 38% in 2021 compare to 2020, according to data from HealthSystemTracker (a KFF outfit). Accident-based deaths increased by 12% in 2021 compared to 2020, while chronic lower respiratory disease (CLRD) death went down by 7%, along with an over 10% decrease in Alzheimer disease deaths.
If the first 74% of 2022 allows for straight-line extrapolation, then kidney disease deaths increased by over 3 standard deviations in 2022 compared to 2021 (a standard deviation in kidney disease deaths is about 2.5% of the mean).
What is going on here?