
ADHD Risk Difference ("vax vs. unvax")
Post #1375

Important Note: My thoughts and prayers go out to the family of conservative icon, Charlie Kirk, who has passed away after being shot at a campus rally. He was a true warrior. Charlie would want for us to continue the mission, and with vigor.
As reported by The Vigilant Fox, a recent hearing in the Senate revealed an unpublished study demonstrating higher risk for several diseases and disorders in children who had taken vaccines, versus those that did not. Attorney Aaron Siri made a remark that was technically accurate, but this is a gentle correction to what he said.
When Mr. Siri said that they could not compare rates for ADHD because there were no positive instances (cases) of ADHD in the unvaccinated children, that is a subtle mischaracterization. It is technically-true that you cannot get a confidence interval (CI) around an incidence rate ratio (IRR) with the conventional method.
But conventional methods are not the only valid statistical methods which exist. A technically-true statement can be inadvertently misleading if it leaves the recipients with the impression that nothing could have been done. I’m not saying that Mr. Siri meant to convey that message at all, only that there was something that could be done.
Here is the statement made by Mr. Siri at the hearing in the Senate:
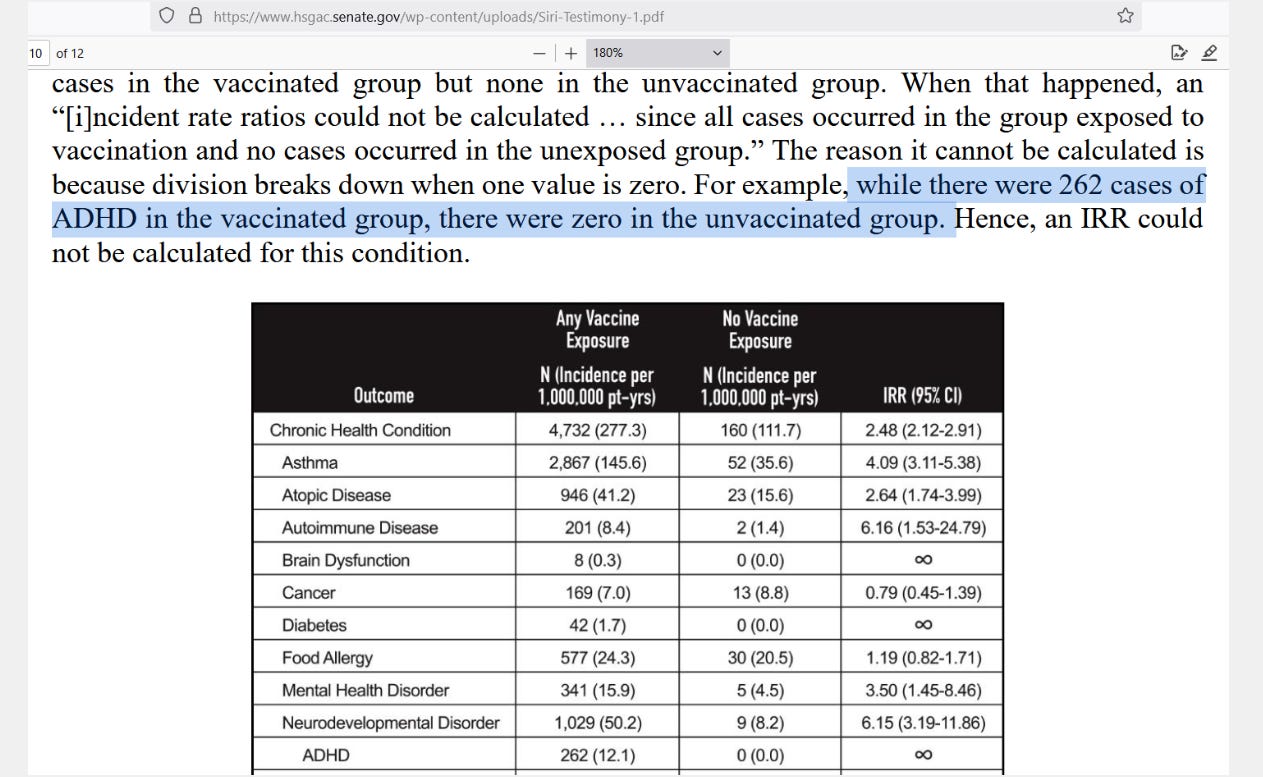
The bottom row in the table shows ADHD, where the vaccinated group had 262 cases, at a rate of 12.1 new-onset cases per million patient-years (per MPY) and the unvaccinated group had 0 cases. The reason that Mr. Siri is under the impression that you cannot get a confidence interval has to do with the standard error (SE) of an IRR:
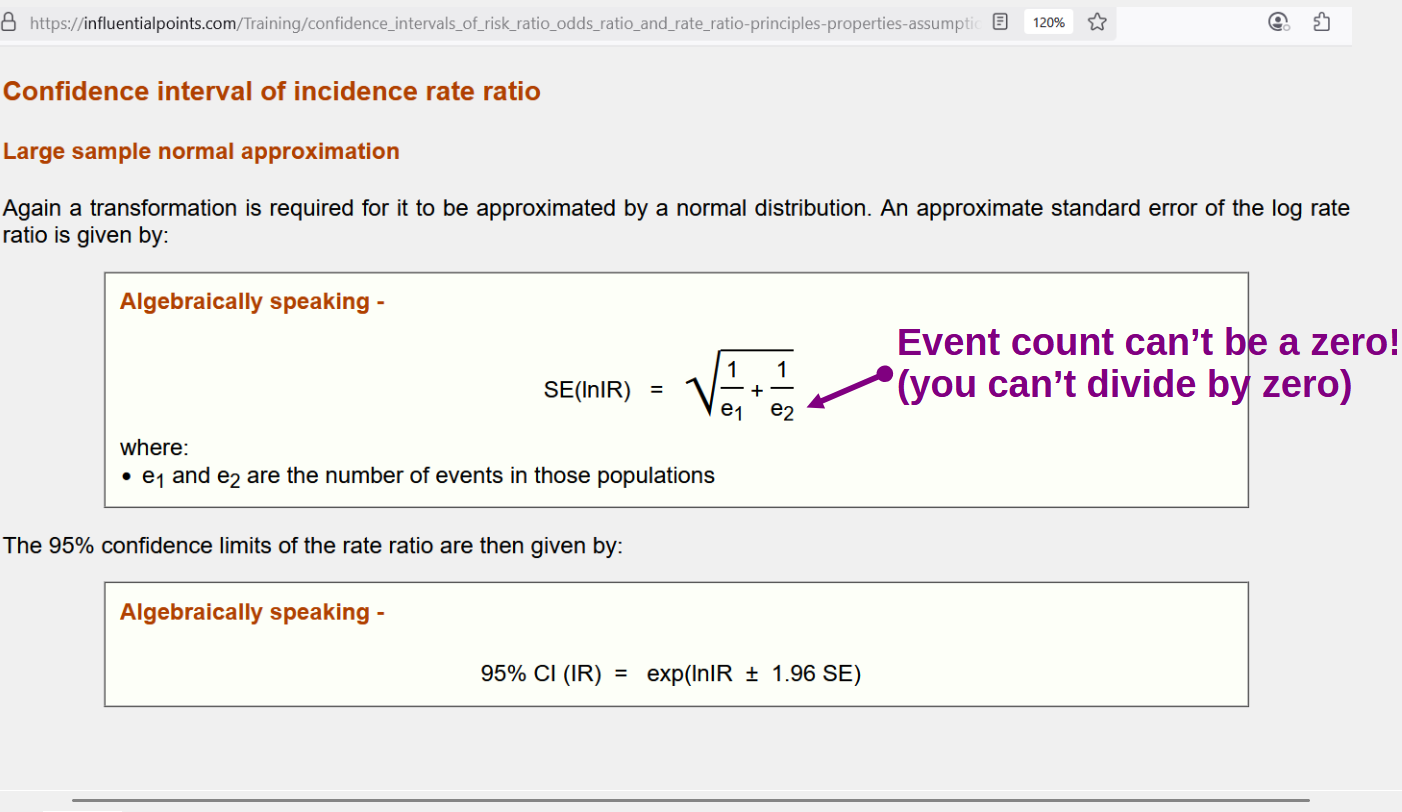
[purple note added]
In this image, e1 would be “262” — the count of ADHD cases among the vaccinated kids, and e2 would be “0” because no cases were found among the unvaccinated kids. While this “IRR problem” can be overcome by other methods empirically shown to work (computer simulations have proved them valid), I will use an easier method:
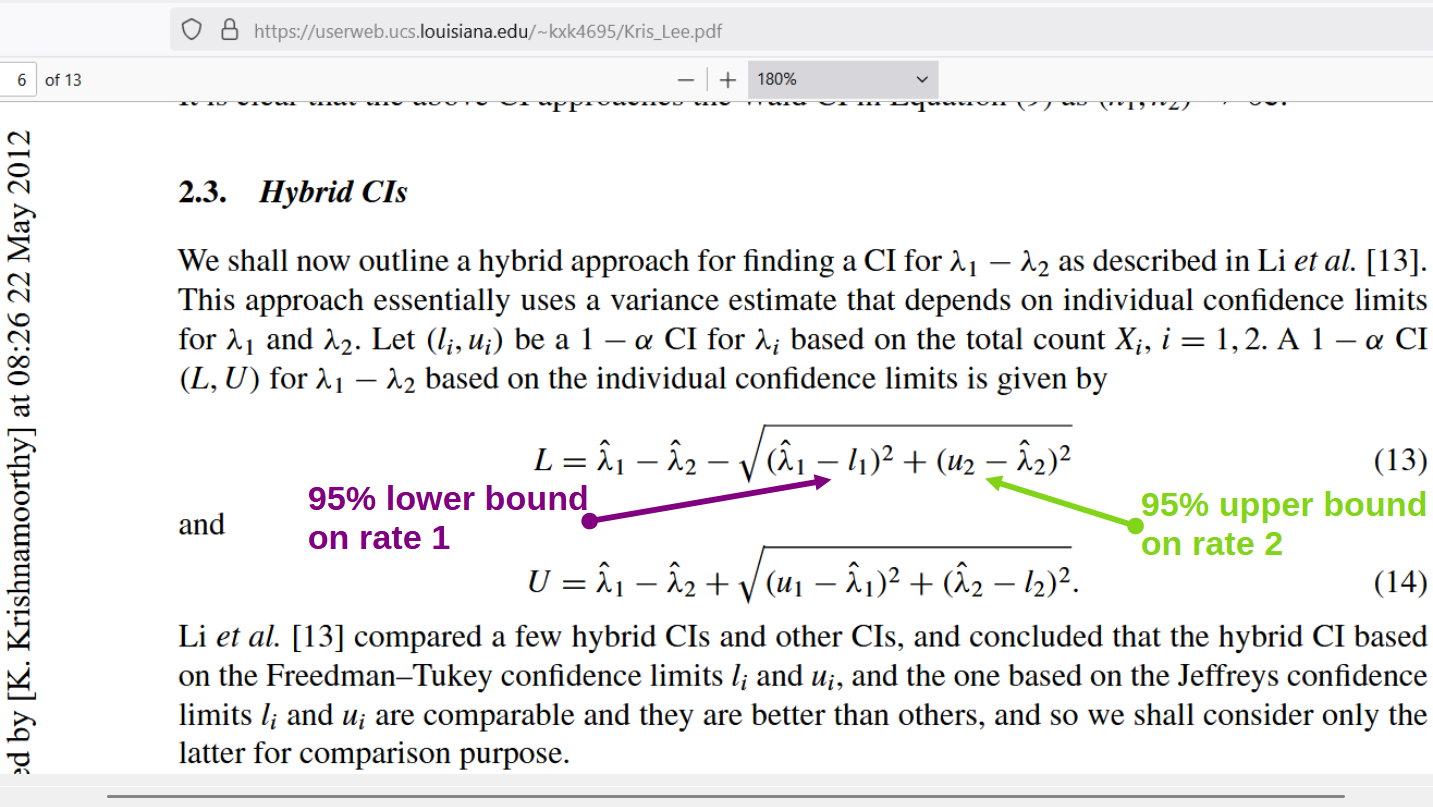
[colored notes added]
The nice thing about this “hybrid CI” method, based on the Poisson Distribution, is that it bypasses the need to use the event count, and only incorporates the confidence boundaries — from the separate and distinct confidence intervals around each individual rate (a Poisson mean is a rate). Those are very easy to compute.
While it looks at the difference of two rates rather than the ratio of two rates, it allows for the computation of the lower bound of a confidence interval around the difference — and careful thinking reveals that the lower bound is the only bound that you will need when evaluating. Here is what it looks like when worked from start to finish:
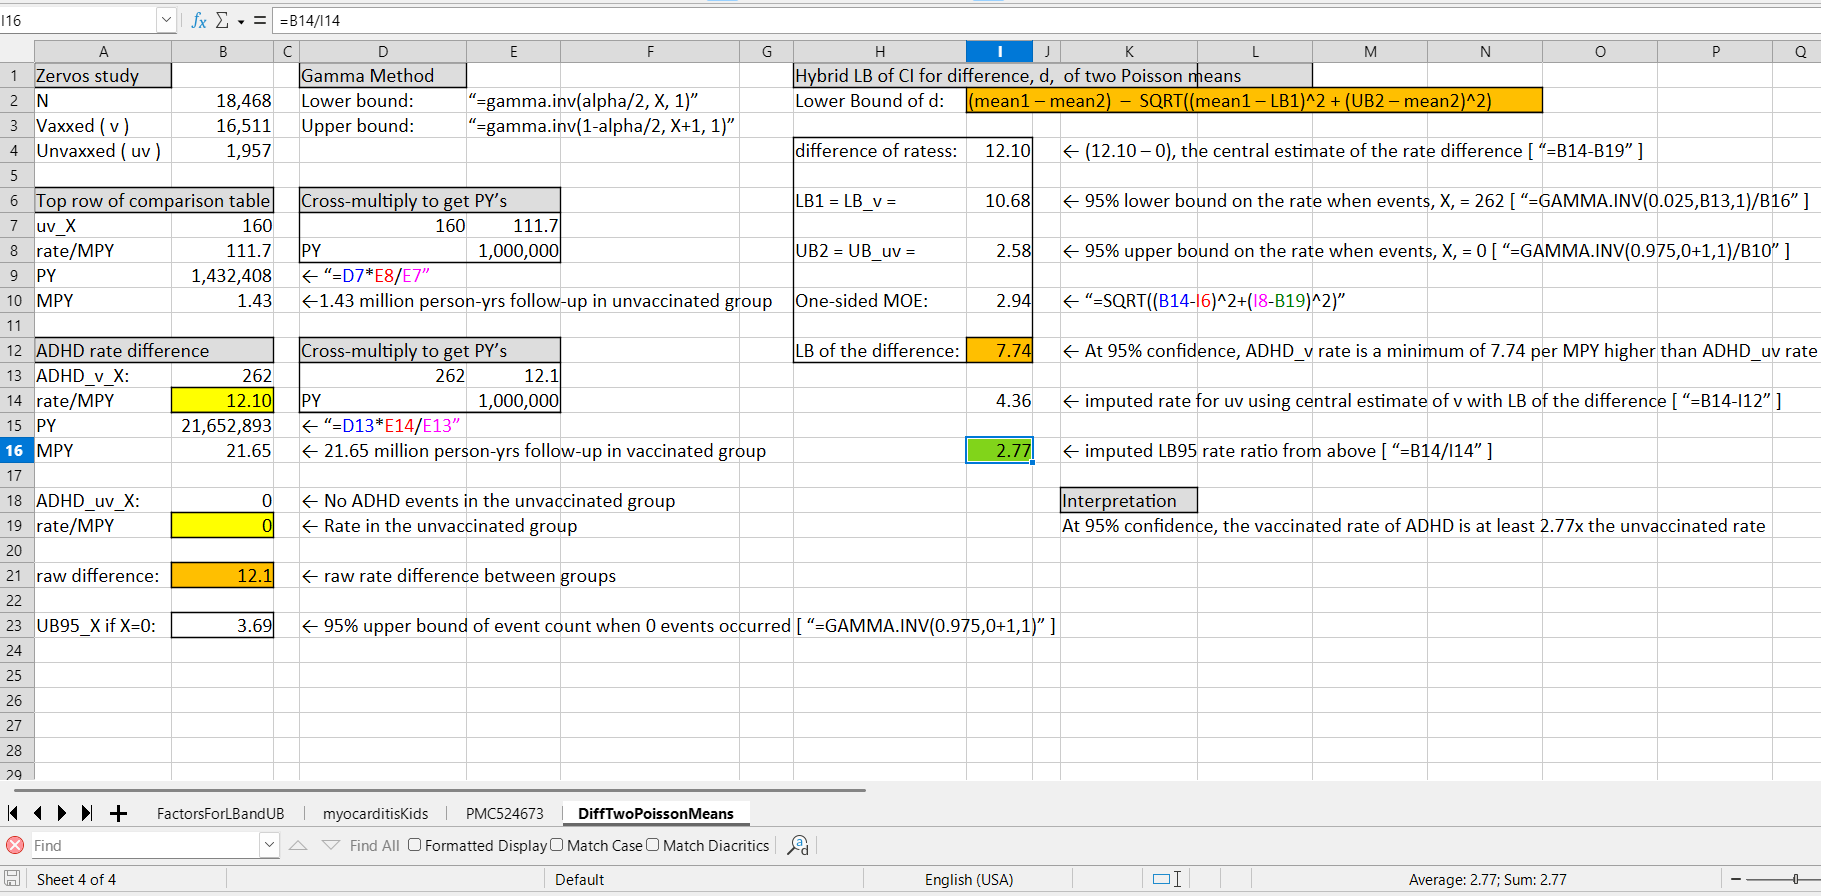
[click to enlarge]
In cell A9, an estimate on the number of patient-years (PY) in the unvaccinated was back-computed from the table shown in the video (video also available at Focal Points). If 160, when put over all of the PY, equals 111.7 when put over one million PY, then the total PY of observation for this group will be 1.43 million PY (1.43 MPY).
A similar method found the PY of observation for the vaccine group (cell A15). The vaccine group is tagged with a “v” and the unvaccinated is tagged with a “uv.” If no events occur, then the 95% upper bound on the count of events will be ~ 3.69. In reverse, when ~3.69 is the true rate, then you will witness 0 events 2.5% of the time.
On a TI84, using “poissoncdf(3.6894,0)” — the actual value is 0.0249869897 (~2.499%).
Knowing that upper bound of the interval on the count of events— obtained when the observed count of events was zero — allows you to get an upper bound on the rate, which is the only thing needed in the formula for a lower bound on the difference of the two rates (though you do need to find a lower bound, it is for the high rate, only).
In other words, the problematic lower bound of an interval based on zero events is completely avoided here! And, again, extensive computer simulations have proved this method to be statistically valid and reliable. While 12.1 per MPY was the observed difference between the rates, the yellow-highlighted cell shows the 95% lower bound:
At 95% confidence, vaccinated kids have an ADHD rate that is higher by at least +7.74 per MPY.
The imputed minimum rate ratio — found by applying the rate difference — is 2.77x. The evidence suggests that, even in comparisons which were not evaluated by the unpublished paper, there was still statistically-significant evidence of harm which could be uncovered using valid and reliable statistical methods.
Reference
[testimony in the Senate by Attorney Aaron Siri] — https://www.hsgac.senate.gov/wp-content/uploads/Siri-Testimony-1.pdf
[standard error formula for incidence rate ratio (IRR)] — https://influentialpoints.com/Training/confidence_intervals_of_risk_ratio_odds_ratio_and_rate_ratio-principles-properties-assumptions.htm
[confidence interval for difference of two Poisson rates] — https://userweb.ucs.louisiana.edu/~kxk4695/Kris_Lee.pdf