


After Initial Mass Dosing, Excess Deaths peak 2-5 months after Dosing Rates do
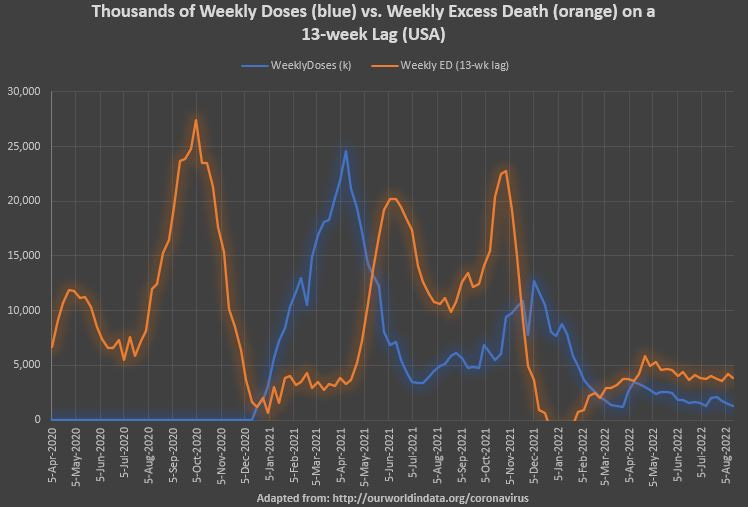
Superimposed Excess Death with a 13-week Lag

In this Substack, I found exactly 15 weeks separating booster shots and excess deaths. Here is a longer timeline showing how it wasn’t always the case that jabs led to excess deaths 15 weeks later (orange curve shifted to the left by 13 weeks):
As you can see, there are different lags involved — possibly for different “batches.” The graphed 13-week lag is putting one of the excess death peaks before the peak jab rate of 5 Dec 2021, indicating that excess deaths peaked in less than 13 weeks for that group. Here is the same graph with notes:
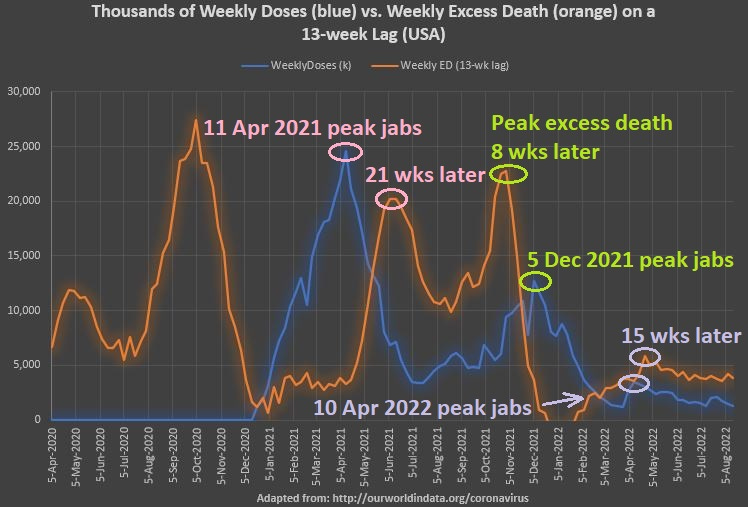
The very first dosing peak (blue) of 5 Apr 2021 might include two excess death (orange) components: immediate deaths and lagged deaths. The immediate (or near-immediate) deaths would include much, if not most, of the highest excess death peak at left.
Then, for that first dosing peak, there are the delayed excess deaths occurring 21 weeks later. While possibly coincidental, the long time-lag, followed by the short time-lag, following by the medium time-lag, is the type of experience that you’d witness if the lag was being externally manipulated and calibrated.