


Apples-to-Apples Flu v. COVID Comparison
Post #519

In this prior post, the sum of pneumonia and influenza deaths were taken as a proxy for excess deaths due to acute respiratory disease, and then compared to the excess deaths during COVID — where excess deaths were a proxy for COVID deaths.
This post removes those proxies and simply compares excess deaths under flu to excess deaths under COVID — an “apples-to-apples” comparison. In 24 European nations in 2017/18, a year with severe flu, excess death was 338 per million.
Let’s compare that rate to the 2020 rate of excess death in 35 regions of the world:
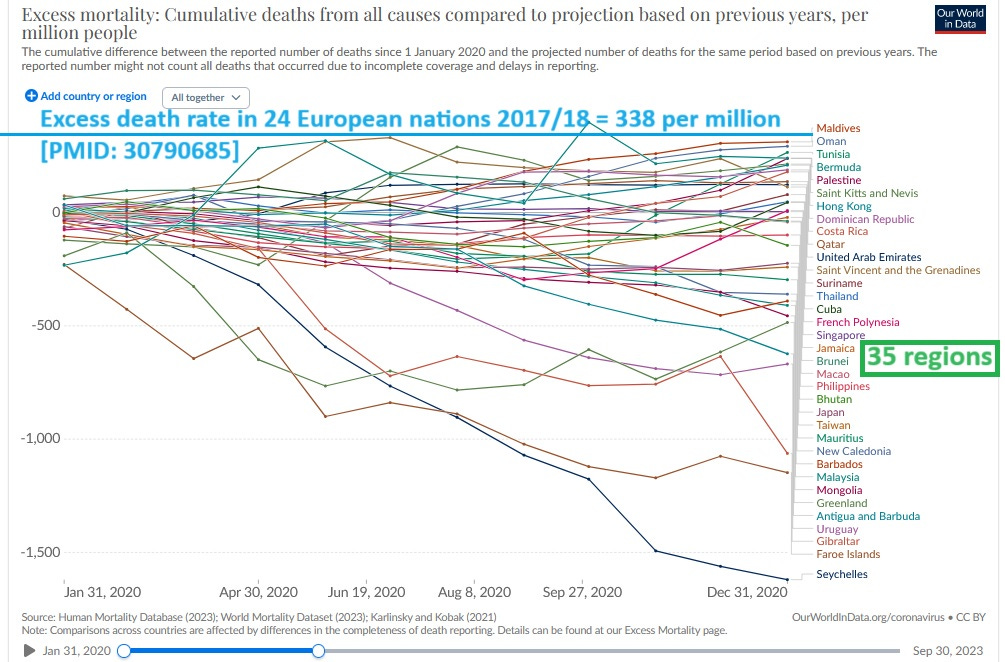
The total number of named “population centers” in the world is about 240. Because 35 of them had less excess death under COVID than was seen in Europe under flu, then that indicates that 15% of the named “population centers” of the world “did better” with COVID — though Europe does have an older age structure.
Even still, claims such as “COVID is 10x worse than the flu!” are conclusively ruled out by the evidence of having 15% of regions doing better under COVID than flu. If COVID had truly been 10 times worse, you would virtually never find 15% doing better under COVID.
Here is a list of the cumulative rates for 2020:

But The Economist estimated excess death per 100,000 out to 28 Dec 2020 for 237 population centers of the world (almost all of them), and 48% of them did better under COVID than Europe did under flu.
To bring that rate up to excess deaths per million, you multiply it by 10, so that 33.8 per 100,000 is equivalent to 338 per million (Europe’s “severe flu” rate). Here are the 114 regions which did better under COVID than Europe did under flu:
Entity ……. excess_deaths_per_100k
Seychelles -151.11
Gibraltar -98.60
Uruguay -66.76
Faroe Islands -62.11
Antigua and Barbuda -61.30
Kiribati -56.00
Saint Pierre and Miquelon -55.27
Fiji -55.06
Vanuatu -51.94
Malaysia -42.26
New Zealand -39.49
Mongolia -37.85
Bhutan -36.96
New Caledonia -32.55
Solomon Islands -31.31
Greenland -28.88
Taiwan -25.33
Mauritius -24.77
Tonga -24.10
Cook Islands -23.61
Pitcairn -23.02
Niue -22.19
Grenada -22.12
Palau -21.02
Barbados -19.83
Wallis and Futuna -18.48
Samoa -16.22
British Virgin Islands -15.88
Tokelau -14.65
Eritrea -14.05
Nauru -13.63
Reunion -13.54
Australia -13.10
Brunei -12.69
Japan -12.38
Anguilla -11.24
China -9.60
Iceland -9.21
Sri Lanka -8.43
Marshall Islands -6.74
Philippines -6.68
Singapore -6.10
Sierra Leone -4.89
Botswana -2.45
Macao -0.96
South Korea -0.28
Central African Republic 0.18
Vietnam 0.75
Lesotho 0.80
Thailand 0.91
Denmark 1.85
Liberia 2.20
Norway 3.57
Saint Vincent and the Grenadines 4.18
Cuba 4.20
Angola 5.91
Jamaica 7.30
Sao Tome and Principe 7.71
Dominica 7.76
Cambodia 7.84
Trinidad and Tobago 8.22
Northern Mariana Islands 9.00
American Samoa 9.50
Saint Lucia 9.90
French Polynesia 10.44
Suriname 10.58
Cayman Islands 11.10
Montserrat 11.62
Equatorial Guinea 11.76
Falkland Islands 12.80
Papua New Guinea 13.09
Saint Helena 13.41
Qatar 13.65
Dominican Republic 14.02
Hong Kong 15.35
East Timor 15.51
Costa Rica 16.36
Gambia 16.49
Cote d'Ivoire 16.50
Indonesia 16.57
United Arab Emirates 17.74
Namibia 17.78
Ghana 19.00
Djibouti 20.01
Benin 20.37
Senegal 20.63
Laos 21.18
Palestine 21.74
Vatican 22.25
Curacao 22.51
Micronesia (country) 23.01
Burundi 23.22
Tunisia 23.62
Finland 25.53
Guinea 26.23
Syria 26.86
Maldives 27.64
Western Sahara 28.03
Eswatini 28.34
Oman 29.30
Burkina Faso 29.60
Togo 29.81
Ireland 30.36
Somalia 30.57
Belize 30.79
Cape Verde 31.33
Haiti 32.12
Venezuela 32.20
Malawi 32.60
Paraguay 32.71
Mayotte 32.97
Cyprus 33.16
Israel 33.26
Gabon 33.43
Evidence suggests that it is physically impossible for COVID to be 10 times worse than flu, because 48% of the regions of the world did better under COVID than Europe did under flu.
The probability of 48% of the world doing better, when the “exposure” is supposed to be 10 times worse, is so low that it “breaks” a TI-84 Plus graphing calculator:
Deep Stats
The standard error of the mean for 237 excess death rates was 46.9 per million. If COVID is 10 times worse, then the expected excess death rate, the mean death rate, would be 3,380 per million.
But to cross the chasm down to 338 per million — i.e., the excess death rate of flu in Europe in the top graph — requires a shifting down by 3,042 per million, which is equivalent to 65 standard errors.
Even using the raw standard deviation of the 237 individual rates, you still need a shift down by 4.2 standard deviations, just to get to the situation of equivalence, let alone 10 times equivalence. That’s equivalent to a Z score of -4.2.
Under an assumption of normally distributed values, only 0.00001 (one one-hundred-thousandth) would lie below the mean by 4.2 standard deviations. You essentially “never” have a population, centered on the value of 3,380, where 48% of that population lies over 4.2 standard deviations below the mean (below 338).*
*Post-script: It is mathematically impossible to have 50% of any population being more than one standard deviation away from the mean.
Reference
[mathematically impossible to have a population median differ from the mean by more than one standard deviation] — Colm Art O'Cinneide. The Mean Is Within One Standard Deviation of Any Median. The American Statistician, November 1990, Vol. 44, N o . 4. Page 292-3. https://gwern.net/doc/statistics/probability/1990-ocinneide.pdf
[excess death per million for 2020] — OWID. https://ourworldindata.org/grapher/cumulative-excess-deaths-per-million-covid
[excess death per 100,000 to 28 Dec 2020] — The Economist. OWID. https://ourworldindata.org/grapher/excess-deaths-cumulative-per-100k-economist
[excess death from the 2017/18 flu in Europe was 33.8 per 100,000] — Nielsen J, Vestergaard LS, Richter L, Schmid D, Bustos N, Asikainen T, Trebbien R, Denissov G, Innos K, Virtanen MJ, Fouillet A, Lytras T, Gkolfinopoulou K, Heiden MA, Grabenhenrich L, Uphoff H, Paldy A, Bobvos J, Domegan L, O'Donnell J, Scortichini M, de Martino A, Mossong J, England K, Melillo J, van Asten L, de Lange MM, Tønnessen R, White RA, da Silva SP, Rodrigues AP, Larrauri A, Mazagatos C, Farah A, Carnahan AD, Junker C, Sinnathamby M, Pebody RG, Andrews N, Reynolds A, McMenamin J, Brown CS, Adlhoch C, Penttinen P, Mølbak K, Krause TG. European all-cause excess and influenza-attributable mortality in the 2017/18 season: should the burden of influenza B be reconsidered? Clin Microbiol Infect. 2019 Oct;25(10):1266-1276. doi: 10.1016/j.cmi.2019.02.011. Epub 2019 Feb 18. PMID: 30790685. https://pubmed.ncbi.nlm.nih.gov/30790685/
Thank-you, only new illness observed as a nurse came from the shots.
Just proves there was no pandemic.