

The health of the vaccinated is a hot topic lately, with many reports coming out about how COVID “vaccines” (experimental injections) were treated by regulatory agencies differently than was every other medical product which was ever known in human history.
Why did regulators treat it so differently than every product in the past?
While it may be a long time before answering why protocols were changed on a broad scale for the “COVID Pandemic” — noting the health effects after vaccines requires knowing the age distribution of those vaccinated in the first place.
For instance, if you know the average age of “the vaccinated” — then you have a benchmark to evaluate an overall death rate of “the vaccinated.” Health outcome numbers can be put into perspective once the age distribution is known.
The mean age of COVID “vaccination” falls over time, due to a combination of elderly being prioritized and a progressive lowering of the minimum age of vaccination. This means that, whenever you get a mean age of vaccination for a nation, then that mean age is the highest mean age that you will ever see, from that point, forward.
Mean Age of Vaccination in the USA
Back in April of 2021, the mean age of a “COVID vaccinated person” in the US had already fallen to 54 years, and the mean age today may be much lower than that:
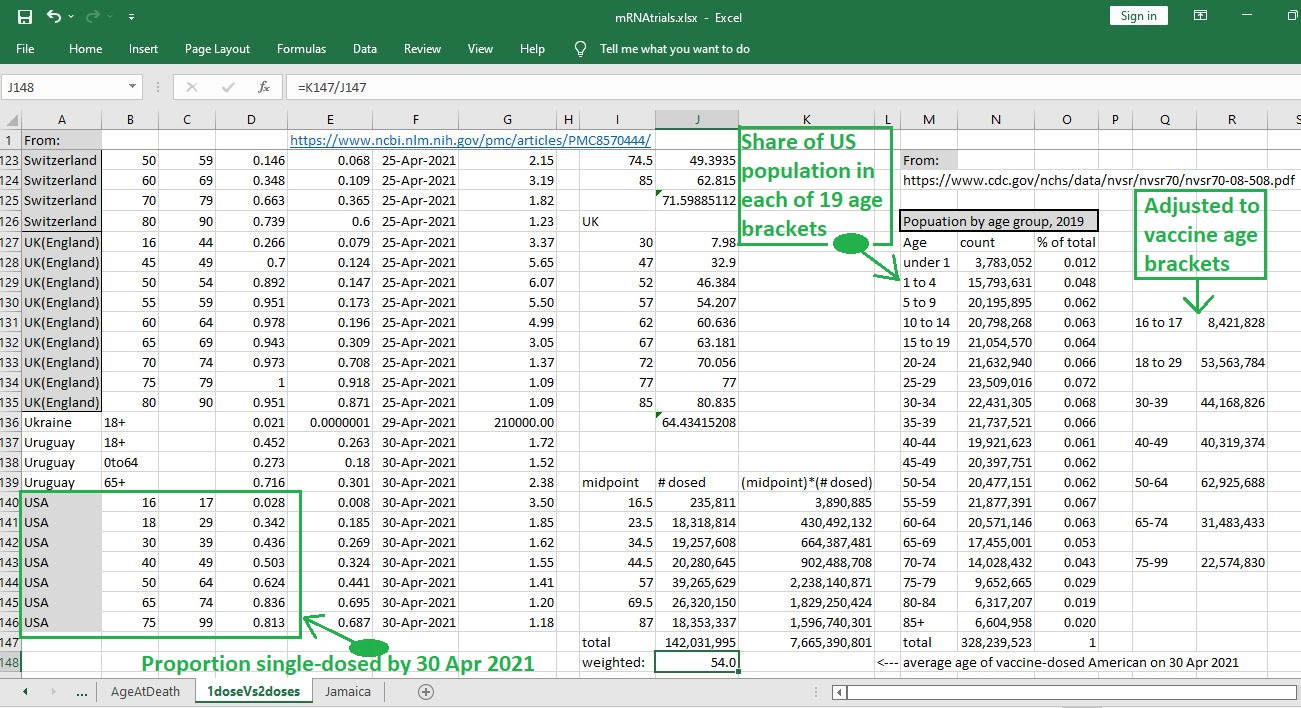
[click on image to enlarge]
The mean age of all “COVID-vaccinated persons” is in cell J48 of the Excel spreadsheet and, to find it, the proportion of US citizens in each of 19 separate age categories was used.
At bottom left you can see that the upper limit of the top age bracket of those vaccinated — originally labelled as “75-and-over” — was set to 99 to achieve a midpoint age (87) that is likely somewhat high (conservative), but it is still “realistic.”
Reference
[proportion in each age bracket with at least one dose] — Pastorino R, Pezzullo AM, Villani L, Causio FA, Axfors C, Contopoulos-Ioannidis DG, Boccia S, Ioannidis JPA. Change in age distribution of COVID-19 deaths with the introduction of COVID-19 vaccination. Environ Res. 2022 Mar;204(Pt C):112342. doi: 10.1016/j.envres.2021.112342. Epub 2021 Nov 5. PMID: 34748775; PMCID: PMC8570444. https://www.ncbi.nlm.nih.gov/pmc/articles/PMC8570444/
[proportion of Americans in every age bracket] — CDC. National Vital Statistics Report #70. https://www.cdc.gov/nchs/data/nvsr/nvsr70/nvsr70-08-508.pdf