

Note: There is a follow-up to this Substack here.
When looking at the peak of weekly excess death, the highest weekly excess death was in January of 2021, after COVID jabs rolled out. But after July of 2021, when booster shots rolled out, excess death peaked again, but this time it was irregular — because it was off-season, peaking in September:
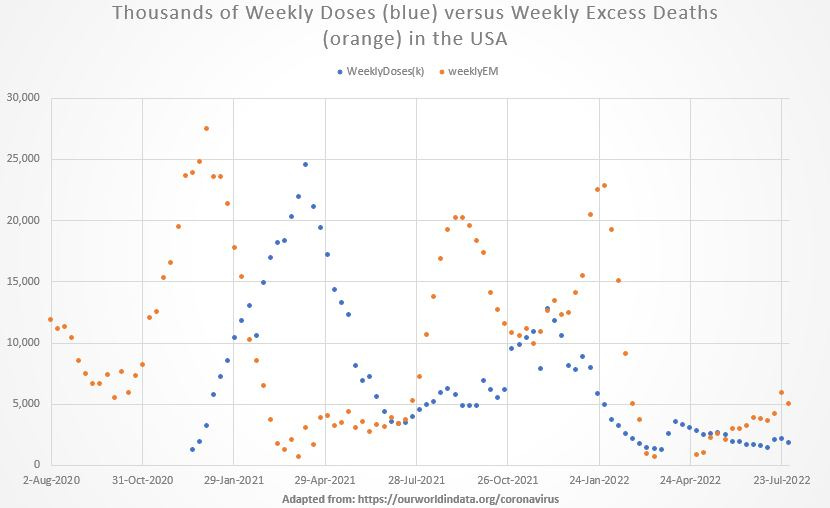
Peak excess death (orange dots) was the week of 3 Jan 2021, after COVID jabs rolled out. The next peak wouldn’t be seen until September of 2021 — after booster shots rolled out.
It is unclear from the pattern of deaths if they are delayed by 5 months post-jab, or if shenanigans have been used in order to make it look like the jab rates are an “echo” of previous excess death rates.
This “data trick” was popularized in the motion picture, Minority Report, when there were three “precogs” (people able to glimpse into the future) and a murder was deliberately foiled, but then quickly followed-up with the intended murder (by following the same pattern as the foiled one).
The police thought that the “second” murder attempt was merely an echo of the first, so they never ascribed any importance to it. When data is hidden and not available for public scrutiny, you can make it seem as if one thing preceded another. Here is the same graph with notes:
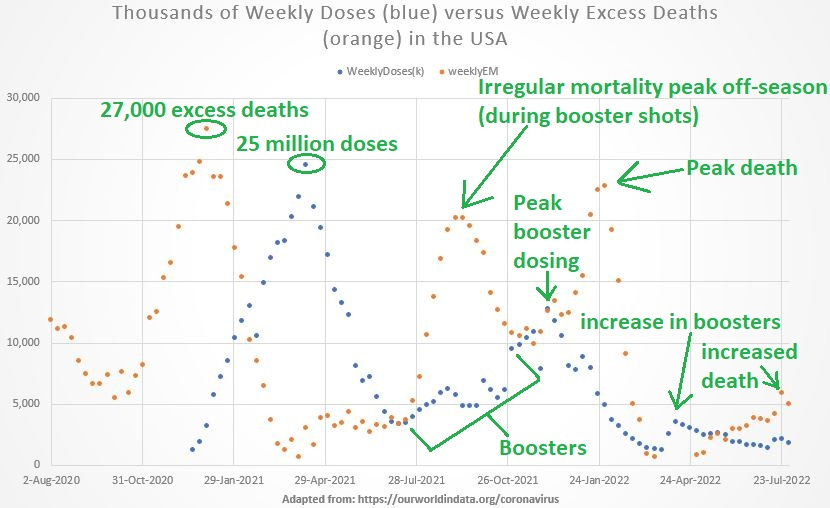
Trend data indicate that a full-pause on COVID boosters is in order.