

Centralized Spending lowers the affordability of a living standard
Centralized Spending lowers the affordability of a living standard
Too much money spent by too few decision-makers

Finance Quiz
1) Who, ultimately, pays off debt?
2) What, ultimately, is used in order to pay off debt?
Answer Key
1) households
2) income
Lost Affordability of Living Standards
Private allocation of resources (ie., economic freedom) is optimal because of how sensitive it is to realities on the ground. A trillion decentralized economic decisions made in a year will always outperform a million centralized ones.
Whenever the government spends more, regardless of what it is spent on, then private decision makers are further restricted, and results end up poor.
But for at least a little while, you can maintain a former living standard even after losing economic freedom, as when the federal government allocates even more of the resources of society — such as by funding more medical research, or whatever.
Although you can only maintain former living standards by going ever deeper into debt. If all non-financial debt got divided equally into all family households, that “per household” share of all debt would be higher than the median family income.
From the early 1950s to the early 1970s, it was 3 times the median income:

But the United States has been drifting away from free market capitalism ever since as far back as at least the 1960s, with a transient restoration of economic freedom during the Reagan years.
Because of moving away from economic freedom, and having the government allocate more and more of the resources (statist centralized economy), the “household share” of debt is now over 9 times the median income.
Centralization is the Cause of Economic Stagnation
Here is the inverse, the income divided by the debt, which shows income as a decimal proportion of debt, along with total (federal + state + local) government spending as a decimal proportion of GDP:

The red line at top left shows median income was ~33% of “per household” debt for at least 20 years in a row. But that red line drops steadily after the blue line (total government share of GDP) crosses 30% of GDP — roughly 16% of GDP for the federal government and 14% of GDP for the state/local governments.
After that level of resource allocation by the government, there was no way to maintain living standards in the US, except by going further and further into debt. Sustainable living standards come from the production of value, something which happens in the private sector.
“Sustainable Growth”
Using the enemy’s language, we can talk about sustainable growth, but not in the sense that they mean. When they say “sustainable” then they mean that you have to eat bugs, and that you will “own nothing, and be happy.”
It’s a scam and the only thing it sustains is their money and power.
But that type of thing doesn’t sustain anything worth having. What’s really worth having, is having it be affordable to maintain a living standard. That thing which is worth having, which is worth sustaining, only comes from a market-driven production of value — i.e., only comes from private-sector production.
To get the GDP just for the private sector, you subtract government spending. Here is the nominal (not adjusted for inflation) private-sector-GDP per capita:

With a few hiccups, it looks like the nominal “dollars per person” have been going up, so there is no cause for alarm yet — until you obtain the real value of those dollars by an accurate index of inflation.
Using the Social Security National “Average Wage Index” (AWI), you get a more accurate index of inflation than the conventional Consumer Price Index (CPI) because the CPI is fraught with subjective “hedonic quality adjustments” — where some bureaucrat somewhere personally decides that quality has improved in a product.
After making that personal and subjective decision, the entire index is shifted. Using the more accurate index (AWI), here is the real private-sector-GDP per capita (real PGDPPC):
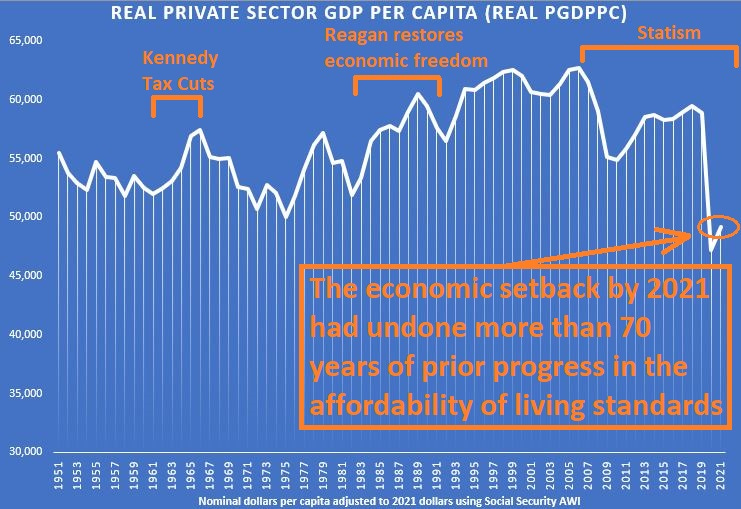
Notice how large the current setback is to the affordability of living standards in the US. Admittedly, 2022 was a little better than 2021, but the data set for AWI didn’t go out that far yet.
Even still, the private sector GDP per capita in 2021 was lower than it had ever been for 70 years of data, and the 2022 value (when available) will still be much, much lower than was seen in 1966 — over a half-century prior.
Even with the improvements of 2022, the economic setback of having the government allocate such a large share of resources sets the USA back by more than 56 years. This is the same thing that happened to Soviet Russia after one single golden decade (1948-1958).
We should have learned from that, rather than trying to emulate them.