In this prior substack, the weekly deaths from EuroMOMO (cited at bottom) in those under age 45 in the Euro Area was shown to be low during COVID (2020), but became high after the rollout of COVID jabs. This post is a follow-up that combines the age groups, but first let’s look at Z scores:
I put a note at bottom because I believe they compute Z scores based on variation in weekly deaths only during non-Winter weeks, which causes the scores to inflate because non-Winter weeks show less variation.
Because 270 people per year were struck by lightning from 2009-2018, and the midpoint population was 318.35 million, the yearly chance of a lightning strike was 1 in 1,179,074 (just less than one-in-a-million).
A Z score of about 4.79 has a probability of being that high of 1 in 1,199,175 — almost the exact same annual chance that a person will be struck by lightning.
A Z score of 7.13 — the highest Z score in the graph above — has a probability of being that high of 1 in 1,992,743,197,952 (about 1 in every 2 trillion)
Though those Z scores are possibly inflated as an artifact of only using “low-variance” weeks to compute variance, we can still interpret the weekly Z scores as being as improbable as they statistically are — if we assume them to occur in non-Winter weeks.
That week of death which led to a Z score of 7.13 (last week of 2022) would then have about a one-in-two-trillion chance of being seen in a random “non-Winter week.” Weekly deaths would be that high by chance alone, for about one week in every 2 trillion weeks — a time which is longer than the time that planet Earth has existed.
But, given that it was a Winter week, the probability of seeing it occur by chance would be somewhat larger.
Here is the combined weekly death data for those in the Euro Area under age 45:
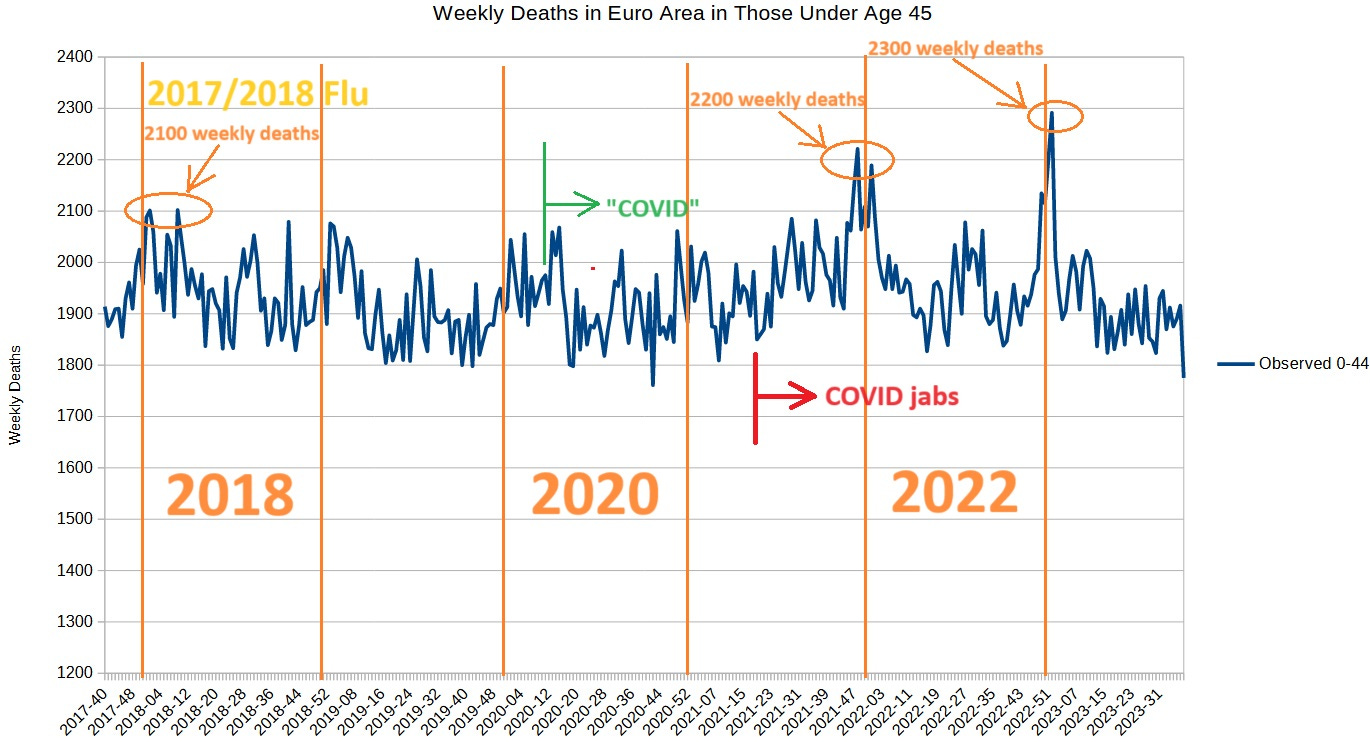
And here is the same graph with notes in it (orange markers separate the years):
Notice how COVID was never as bad as the seasonal flu from 2017/18 for this age group. Also notice how it wasn’t until the rollout of the COVID jabs that weekly deaths rose higher.
Evidence suggests that, for this age group, COVID wasn’t more dangerous than flu, but the COVID shots, themselves, were more dangerous than flu.
Reference
[deaths in the Euro Area] — Pooled number of deaths by age group. EuroMOMO Graphs and Maps. https://www.euromomo.eu/graphs-and-maps


“Evidence suggests that, for this age group, COVID wasn’t more dangerous than flu, but the COVID shots, themselves, were more dangerous than flu.”
And that is a huge point that needs shared far and wide. Thank you. I will be using this in the face of ignorance and cult like oppression on SM.