
COVID Experience in 3 Nations
Denmark, The Netherlands, Norway

A very good report exists for excess death in The Netherlands during the severe flu season of 2017/18. The 12-month excess death due to flu there was 546 per million, which is one of the highest estimates of excess death due to flu.
To get perspective on that year of excess death, here is a graph of the total, accumulated excess death per million for The Netherlands, Denmark, and Norway for most of 2020:
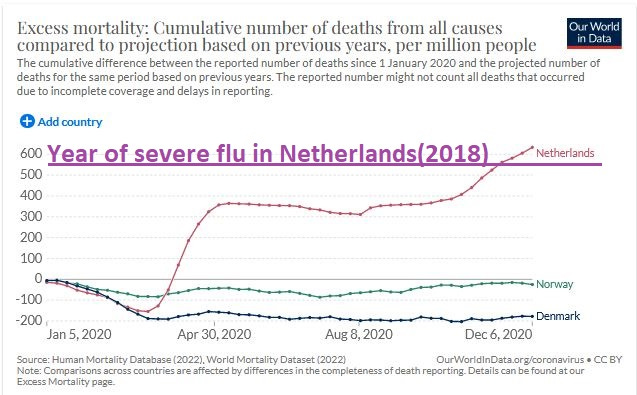
The flat purple line indicates the accumulation of excess death that was seen in 2017/18. Notice how COVID in The Netherlands was slightly worse than severe flu.
Also notice how COVID in Denmark and Norway was not anywhere near being as bad as severe flu — because excess death remained negative there prior to COVID vaccinations.
Let’s go out a second year now, noting the accumulation of excess death going forward to Jan 2022:
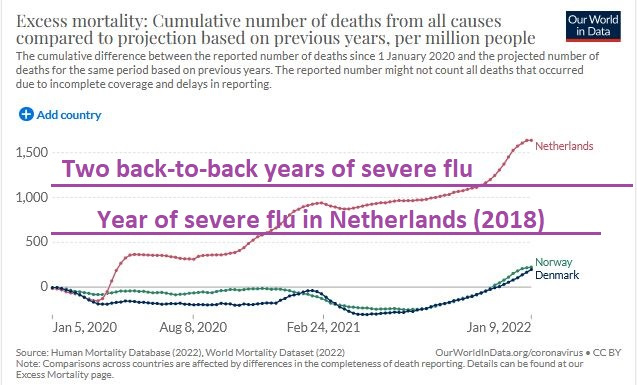
Once again, COVID was worse than severe flu in The Netherlands but, after the vaccines rolled out, the accumulation of excess death was about twice as bad as severe flu — instead of only being slightly worse than severe flu, like it was in 2020.
Also once again, the experience of two full years of COVID in Denmark and Norway wasn’t even close to being as bad as just a single year of severe flu in The Netherlands, though after COVID vaccines rolled out, excess deaths began to climb and climb.
Until October of 2020, the incidence of COVID infection was pretty similar between Denmark and The Netherlands, but was lower for Norway:
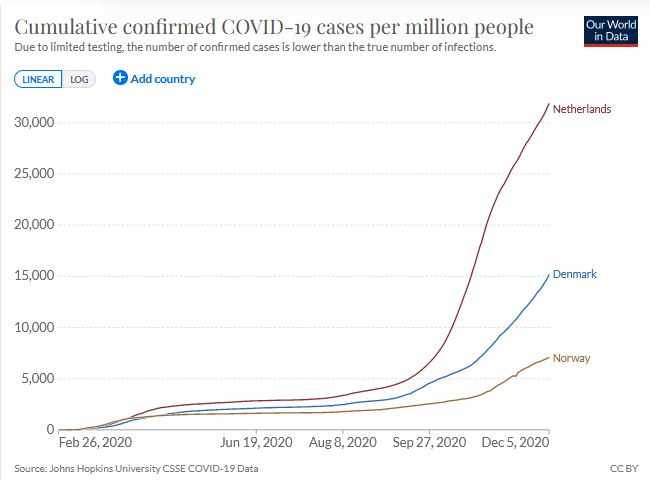
Notice how it is that, by the first week of December of 2020, confirmed infection prevalence in The Netherlands had reached 30,000 COVID cases per million (3%). Research has indicated that actual infection prevalence is 2-5 times higher than the confirmed cases though.
Let’s pan forward in time and mark the spot where The Netherlands had reached 30,000 confirmed cases per million, while noting how, on a longer time-scale, that steep rise to the initial 30,000 appears flattened out:
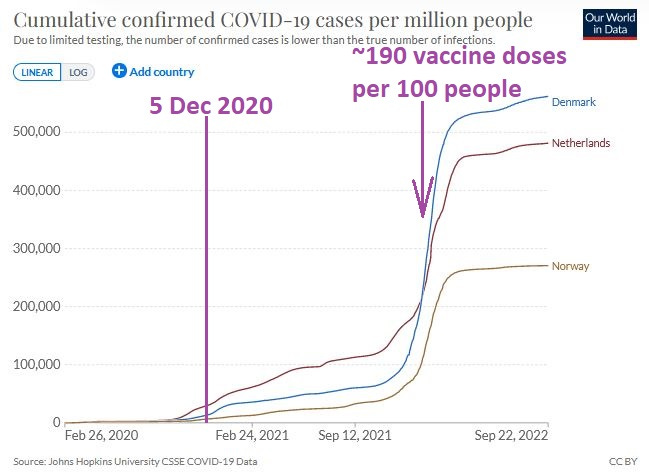
As you can see, COVID infection didn’t really take off like a rocket until most everyone had become fully-vaccinated against COVID. The purple arrow at right indicates a point where there was an average vaccine uptake of about 190 doses per 100 people.
Evidence suggests that, not only was COVID similar to severe flu in these places, but it took COVID vaccination before there’d be huge increases in COVID infection and excess death.
This is the diametric opposite of what you would expect from a broad vacccine campaign, however — suggesting that COVID vaccines were the primary driver of morbidity during the COVID pandemic, and that the disease, itself, was comparable to (not statistically different from) a severe season of flu.
Data from other nations may appear to contradict this, but deaths are something which can be explained in many ways. Yet there is only one way to explain the absence of excess death in Denmark and Norway for the year of 2020:
COVID, itself, wasn’t substantially worse than severe flu.
Let me restate that point for effect:
A huge excess of death can get explained in many ways (e.g., disease caused it, really bad medicine caused it, postponed care caused it, 5G radiation, etc) but an absence of excess death can only be explained in one way:
COVID, itself, wasn’t substantially worse than severe flu.
Reference
[cases, vaccinations, and excess deaths per million] — OWID hub page. https://ourworldindata.org/coronavirus
[9373 excess deaths in The Netherlands for 2017/18] — van Asten L, Harmsen CN, Stoeldraijer L, Klinkenberg D, Teirlinck AC, de Lange MMA, Meijer A, van de Kassteele J, van Gageldonk-Lafeber AB, van den Hof S, van der Hoek W. Excess Deaths during Influenza and Coronavirus Disease and Infection-Fatality Rate for Severe Acute Respiratory Syndrome Coronavirus 2, the Netherlands. Emerg Infect Dis. 2021 Feb;27(2):411-420. doi: 10.3201/eid2702.202999. Epub 2021 Jan 4. PMID: 33395381; PMCID: PMC7853586. https://www.ncbi.nlm.nih.gov/pmc/articles/PMC7853586/
[17.181 million mid-season population in The Netherlands for 2017/18] — World Bank, Population, Total for Netherlands [POPTOTNLA647NWDB], retrieved from FRED, Federal Reserve Bank of St. Louis. https://fred.stlouisfed.org/series/POPTOTNLA647NWDB