

COVID Hall of Fame
COVID Hall of Fame
A condensed review of outlandish COVID findings (viewer discretion is advised)

Contents Quick Look
====================
Part 1: Likely UK systemic miscategorization of death (14% all UK deaths in elderly)
Part 2: Scary US vaccine breakthrough hospitalization death rate
Part 3: Horrific Israeli post-dose death rates
====================
Part 1: Irregularity discovered in UK Death Data
Both Israel and the UK keep good statistics and are also relatively open about sharing the data with their citizens. The UK posts an age-breakdown on the rate of vaccine uptake, and also posts an age-specific death count by vaccination status.
A group of researchers put together a report (on ResearchGate, Jan 2022) which uncovered wide changes in death rates among the unvaccinated which were mysteriously synchronized in time with the vaccine rollouts for the elderly age groups.
For example, if there was a vaccine rollout for those of age 60 to 69 then, very shortly after, there was a large increase in death among the “unvaccinated” 60 to 69 year olds. Importantly, the large increase in death even held true when looking only at non-COVID deaths.
While there might be some kind of an explanation if only COVID deaths increased in the unvaccinated right after other people of their age group got vaccinated, a time-sensitive, large increase in non-COVID deaths is completely unexplainable.
Astonishingly, they estimated that 14% of all elderly deaths were being miscategorized.
If someone takes a vaccine jab, and then soon dies, it’d get reported that that person died while unvaccinated — because the accounting process doesn’t count you as vaccinated until weeks later, when sufficient antibodies have built up.
If the estimate of 14% held true for all age groups and even in the USA, then this accounting sleight-of-hand could cover literally every COVID death in 2021. In 2021 in the USA, there were 3,449,000 deaths.
If 14% are miscategorized, then that would be 483,000 wrongly-associated deaths. But as the image below shows, there were 460,432 COVID-associated deaths in 2021:
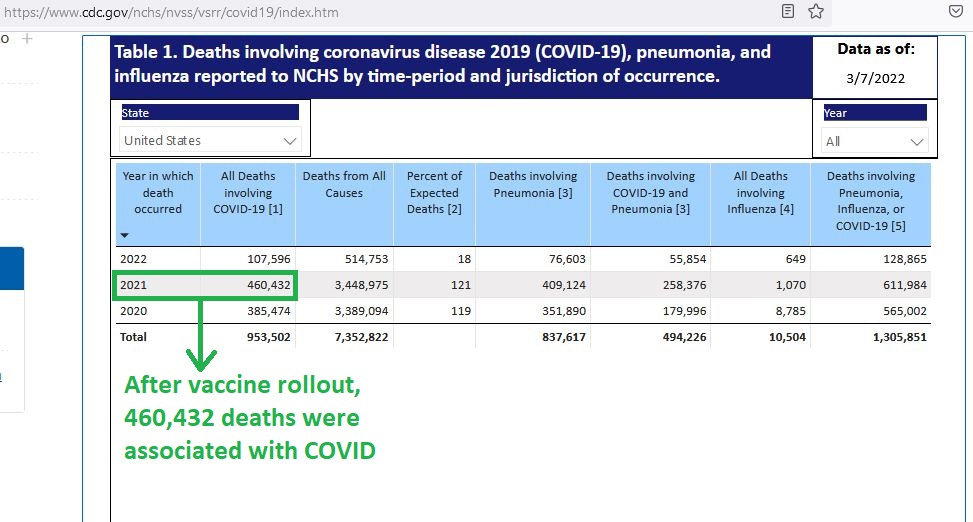
This means that, if UK data is true for all ages and for both nations, then there is enough to pad the death accounts by so much that it could conceivably cover literally every COVID death after the vaccine rollout.
Building on the work of the researchers noted above (which dealt with those over age 60), I graphed a similar time-sensitive mortality change in the next oldest group (age 50-59):
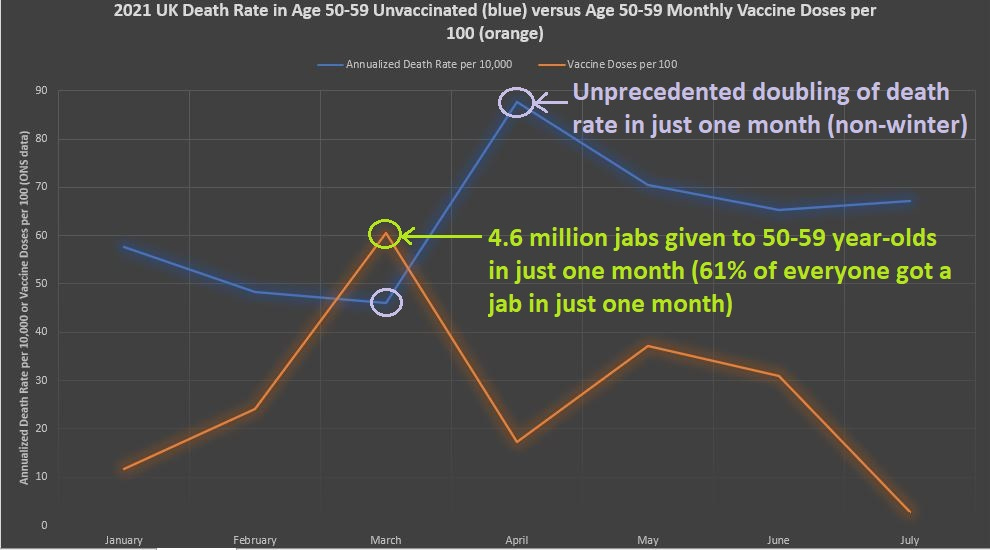
Notice how March was the really big month for vaccinating those in their 50’s in the UK. In that month alone, 61% of everyone in that age group got a jab (4.6 million doses administered, just to those in their 50’s).
Also, notice how the mortality rate in the unvaccinated shot up, with a month-to-month increase which was almost 100% — even in a non-winter month. For those deaths that are from natural causes, such as deaths from diseases, death rates in the UK vary by month a little more than they do in the US.
In the US, for deaths by natural causes, adjacent non-winter months are within 15% of each other (data not shown). In the UK, adjacent non-winter months may differ by up to 25%, and the adjacent winter months may differ by up to 40%.
This makes the “over-90%” jump in monthly death (in non-winter) which is shown in the graph for the month of April a statistical outlier — one would not expect that much more death to occur from a natural cause, such as a from a disease.
This brings up the possibility that an artificial cause of death is in play.
Part 1 References
[ResearchGate report] — Official mortality data for England suggest systematic miscategorisation of vaccine status and uncertain effectiveness of Covid-19 vaccination. January 2022 DOI:10.13140/RG.2.2.28055.09124
[CDC provisional deaths data] —Available: https://www.cdc.gov/nchs/nvss/vsrr/covid19/index.htm
[Graph of those aged 50 to 59 in the UK] — adapted data from the UK Office of National Statistics (ONS) and National Immunisation Management Service (NIMS).
—Monthly age-specific vaccine uptake/coverage statistics from:
https://www.england.nhs.uk/statistics/statistical-work-areas/covid-19-vaccinations/
—Monthly age-specific death rates from:
Deaths involving COVID-19 by vaccination status, England: deaths occurring between 1 January and 31 October 2021
Age-standardised and age-specific mortality rates for deaths involving COVID-19 by vaccination status; deaths occurring between 1 January and 31 October 2021 in England.
https://www.ons.gov.uk/peoplepopulationandcommunity/birthsdeathsandmarriages/deaths/bulletins/deathsinvolvingcovid19byvaccinationstatusengland/deathsoccurringbetween1januaryand31october2021
PART 2: Scary US vaccine breakthrough hospital death rate
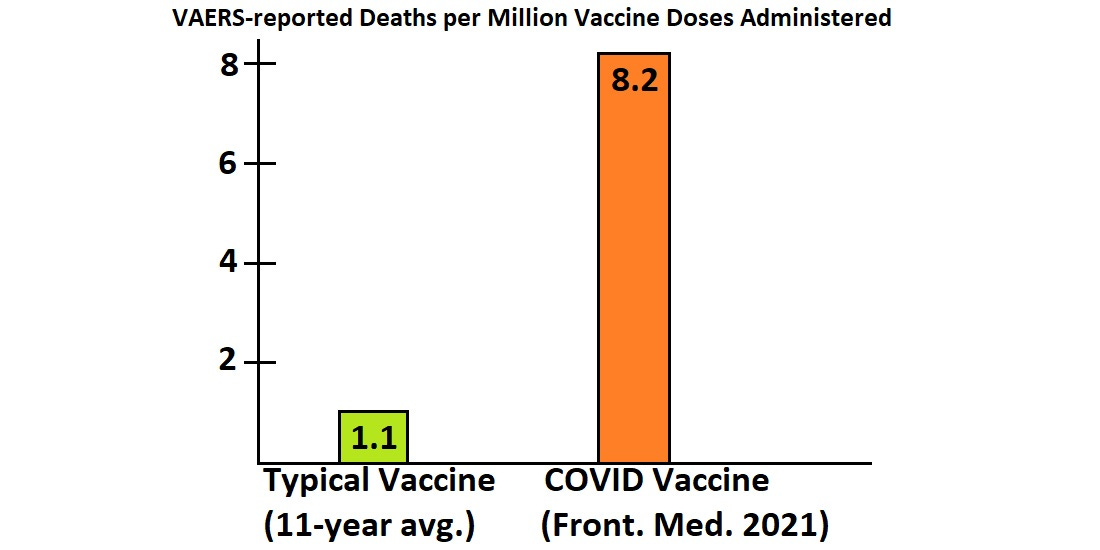
In the first half of May, a report was published in the journal Frontiers in Medicine which found that there were 8.2 death reports in the Vaccine Adverse Event Reporting System (VAERS) for every million doses of COVID vaccine which had been administered.
That contrasts with the rate of VAERS-reported deaths for typical vaccines which comes from an 11-year average in a summary report in CDC’s Morbidity and Mortality Weekly Reports (MMWR): typical vaccines lead to 1.1 VAERS reported deaths per million doses administered.
Here is how the two rates look side-by-side:
CDC recorded the VAERS reports for 11 years (total ~ 1.9 billion vaccine doses). Here is an image showing the number of deaths reported to VAERS in each of those 11 years:

The total deaths reported, divided by total vaccine doses, gives a rate of 1.1 per million.
That is a start-point: We are starting with preliminary data that tells us that we are dealing with a vaccine that is over 7 times more dangerous than typical vaccines. That’s a big jump in risk.
It may make sense if it was a vaccine which stopped a disease which is over 7 times more dangerous than other diseases we take vaccines for (measles, mumps, rubella, etc.). But evidence suggests that COVID isn’t over 7 times more dangerous — even if a top US government bureaucrat once said so.
The current party-line reasoning which is supposed to explain the more-than-7-fold increase is that people are more enthusiastic about reporting to VAERS when someone dies — while in earlier times, people just didn’t care as much when their loved ones died shortly after taking a vaccine.
This means that we actually have the same deaths as before, but those reporting the deaths have become so sensitized that they do not let even one death go unreported.
Underreporting, though, is a fact (not a theory), and VAERS data may catch just 5% of serious adverse events such as death.
But the “eyes-closed-then-eyes-open-now” reasoning sounds fishy though. Death is pretty important. It’s worth reporting. It’s hard to imagine that over 85% of people in earlier times simply just didn’t care enough to report the death of their loved ones to VAERS.
But that is what the government is asking you to believe.
Another disturbing irregularity of data is how COVID in 2021 was becoming less lethal in places like Sweden, but supposedly retained its original lethality in the USA. You can tell if a disease is lethal by finding out how many cases are needed in order to produce one death.
Here is a graph of the USA and Sweden, showing the amount of cases that were found for every COVID death reported:

The data from Sweden end in May, because the deaths in Sweden after May were so low that they would lead to artefactual variance in the ratio of cases to deaths.
The cutoff point was at half of the season-average pneumonia & influenza death from the 2017/18 flu season — back when there was a season average of 2.04 daily deaths per million (data not shown).
Half of that daily death rate is 1.02 daily deaths per million, and in Sweden, COVID wasn’t even half as bad as flu from June 2021 to the end of the 2021 year. Even the US dipped below the “half-as-bad-as-flu” mark in June of 2021.
After July of 2021, another shoe dropped, and CDC whistleblowers leaked an internal communications presentation to the Washington Post. Here is a slide from the leaked data:
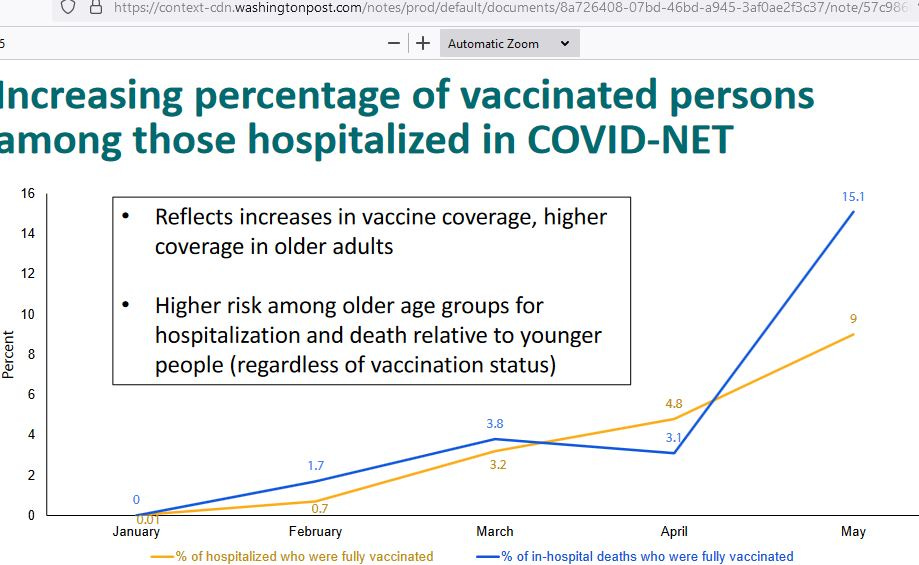
Notice how the deaths among the vaccinated (blue) who were also hospitalized (yellow) was in proportion for the months of Jan, Feb, Mar, and Apr — but in May, the deaths are out of proportion to the total number of those hospitalized who were also vaccinated.
The rough estimate when the vaccinated make up 9% of all hospital patients, but 15.1% of all hospital deaths, is that the vaccinated hospital patients are 68% more likely to die than the unvaccinated hospital patients.
The box insert attempts to explain away the excess hospital deaths seen in those who have taken a vaccine by reasoning that more elderly were vaccinated than young, so that the age distribution of the vaccinated patients would be higher than the age distribution of the unvaccinated ones.
But the big shift in proportionality of the share of inpatients vaccinated vs. the share of hospital deaths vaccinated, if it continued past May, would quickly overwhelm such reasoning.
Related data which has since been taken down by CDC (removed from the internet, after being published there), shows high hospital death rates among the vaccinated up to October 2021, when the ratio of the young to the elderly with regard to vaccination was not lopsided anymore:
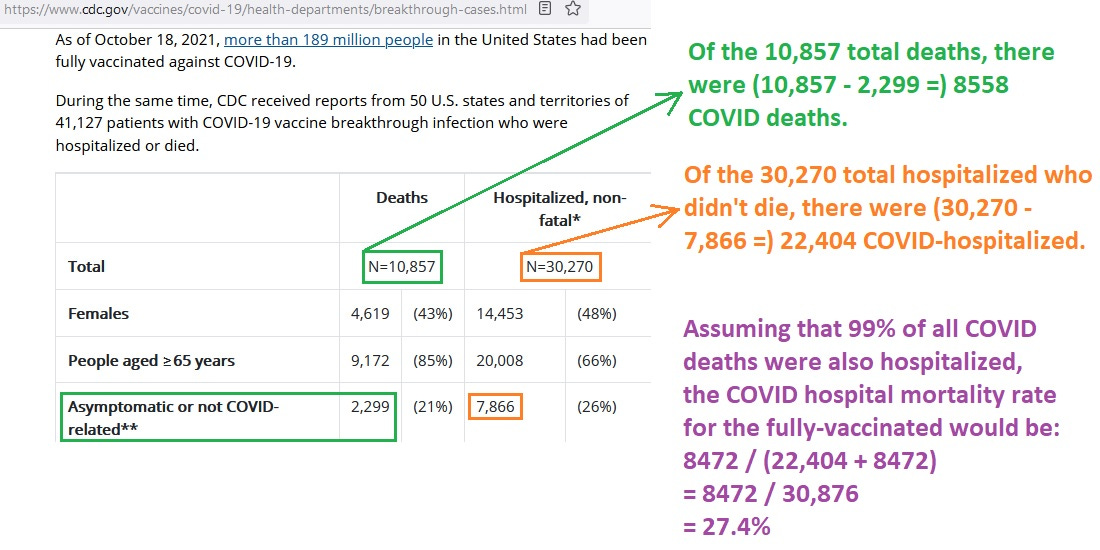
If a vaccine breakthrough hospitalization comes with a 27.4% chance of death, that’d confirm the suspicion with regard to the leaked CDC slide above — it appears that that disturbing trend continued. By Aug 2020 in the US, COVID treatments and natural immunity had improved by so much that only 6.5% of COVID-hospitalized ended up dying.
That was before vaccines.
The breakthrough hospital death rate shown just above (27.4%) is over 4 times higher than that though, which is a safety signal, because vaccines shouldn’t ever make you 4 times more likely to die if you are hospitalized.
Part 2 References
[1.1 VAERS-reported deaths per million general vaccine doses administered] — CDC. MMWR Report. Available: https://www.cdc.gov/mmwr/preview/mmwrhtml/ss5201a1.htm
[8.2 VAERS-reported deaths per million COVID vaccine doses administered] — Lv G, Yuan J, Xiong X, Li M. Mortality Rate and Characteristics of Deaths Following COVID-19 Vaccination. Front Med (Lausanne). 2021 May 14;8:670370. doi: 10.3389/fmed.2021.670370. PMID: 34055843; PMCID: PMC8160119. Available: https://www.ncbi.nlm.nih.gov/pmc/articles/PMC8160119/
[Graph of number of cases required to produce one COVID death] — Adapted data from OWID (ourworldindata.org) data at: https://ourworldindata.org/coronavirus [hub page linking out to both cases and deaths]
[Leaked Internal CDC Communication (a slide from a "presentation" given internally on 29 Jul 2021) published online by Washington Post] — Available: https://context-cdn.washingtonpost.com/notes/prod/default/documents/8a726408-07bd-46bd-a945-3af0ae2f3c37/note/57c98604-3b54-44f0-8b44-b148d8f75165
[Saved screenshot of formerly-published CDC data which has since been removed from the internet by CDC]
[COVID treatment + naturally-acquired immunity improved by so much that the Aug 2020 hospital death rate had reduced down to just 6.5% of COVID patients dying] — Available: Nguyen NT, Chinn J, Nahmias J, et al. Outcomes and Mortality Among Adults Hospitalized With COVID-19 at US Medical Centers. JAMA Netw Open. 2021;4(3):e210417. doi:10.1001/jamanetworkopen.2021.0417 https://jamanetwork.com/journals/jamanetworkopen/fullarticle/2777028
Pull-quote:
"There was a significant reduction in mortality over the course of the 6-month period, with the highest mortality in March (3657 of 16 517 patients died [22.1%]); mortality decreased each month until the end of the study period in August (1154 of 17 776 patients died [6.5%]) (χ2 for trend, 3592.3; P < .001) (Figure, B)."
Part 3: Horrific post-vaccine dose deaths in Israel
Hervé Seligmann is a researcher who discovered high death in Israel in the few weeks following vaccine doses. He cited a report on official statistics which came out on 11 Feb 2021. The report showed the people who were followed after vaccine doses, and how many of them died early on after that.
Seligmann calculated that the few weeks of excess death from taking the vaccine was so high that in order to make up for it, then the original, two-dose vaccine protocol would have to fully protect you from COVID for more than 20 months.
A year-and-a-half (18 months) of complete protection from COVID — from the original, two-dose vaccine protocol — would not be enough protection for the vaccine to have merit (to save more lives than it costs). I follow his line of thinking, but add a twist to the estimation of baseline death rates for those over age 60.
Here is the original report in Hebrew:

And here is a “Hebrew-to-English” translation of the key parts of it:

Seligmann computed a baseline death rate for those over age 60, in order to compare it to the death rate seen after taking a vaccine dose. For the first two weeks after dose 1, the death rate for those vaccinated was 14 times higher than his computed baseline.
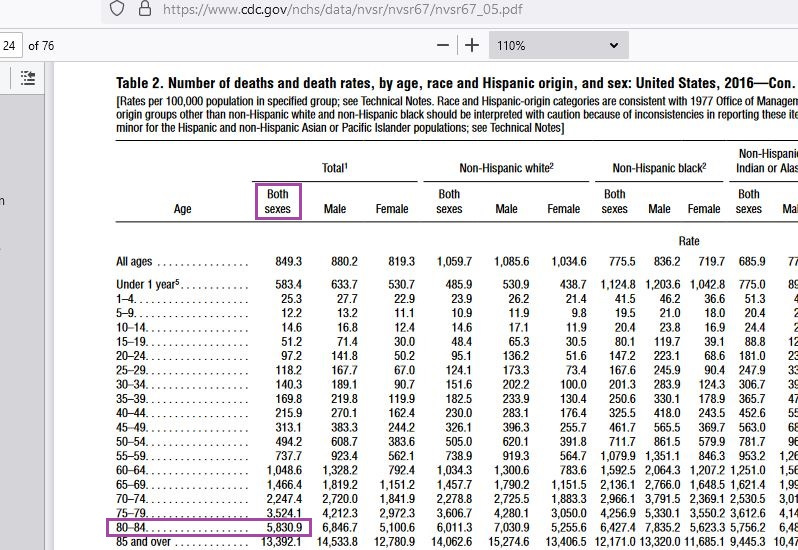
I make the assumption that the baseline “over 60” death rate in Israel can be estimated by the “age 80 to 84” death rate found in the USA (5830.9 per 100,000 yearly):
If my estimate is more accurate than his, then things are even worse than what he found. There were 7438 people followed for 14 days after the first dose, for a total of (7438 * 14 =) 104,132 person-days of observation.
At an annual death rate of 5830.9 per 100,000, the average daily death rate is 0.000160 (1.6 daily deaths per 10,000). The expected total death at the end of 2 weeks, when a cohort of 7438 is followed for 14 days, is then (0.000160 * 104,132 =) 17 total deaths.
But those who took the first dose of vaccine died at a rate 20 times higher than that, for those 2 weeks post-dose. Their daily death rate was 0.003303, for a daily rate of excess death of (0.003303 - 0.000160 =) .003143, and a cumulate rate of excess death of (0.003143 * 14 =) 0.044002.
That accumulated excess death risk (0.044002) must then be made up for by vaccines completely protecting you from COVID for a long, long time.
The risk of death from COVID can be estimated by the annual attack rate of 9.4% (twice the highest Pfizer trial, 6-month attack rate of 4.7%), along with an age-specific COVID infection fatality rate (IFR) of 5.4% — ie, from a Danish study IFR for those of age 70 or more.
The annual risk of COVID death is then (0.094 * 0.054 =) 0.005076. The daily risk is (0.005076 / 365 =) 0.000014.
If in those two weeks after the first dose, you undergo an additional (excess) risk of death that is 0.044002, then in order to just get back to zero harm, the vaccines would have to completely protect you from COVID for (0.044002 / 0.000014 =) 3143 days — which is over 8 years of complete protection from COVID, just to get back to zero.
But complete protection from COVID doesn’t even last 8 months, let alone 8 years, which calls the final merit of the vaccines into question.
Part 3 References
[original report on Israel by Seligmann] — Available: https://covidcalltohumanity.org/wp-content/uploads/2021/08/6097799a8f5a5318e5e6073f_Exp-Herve-Seligmann-Eval38-H-signed.pdf
[11 Feb 2021 report by Ynet News site on official Israel vaccine statistics] — Available: https://www.ynet.co.il/news/article/rJ9Bs0zW00
[English to Hebrew online translator] — Available: https://duckduckgo.com/?q=translate&ia=web
[Plausible estimate for Israel's baseline "over 60" death rate is the US death rate for the age 80-84 group from CDC's National Vital Statistics Report] — CDC. NVSS. Volume 67. Number 5. Available: https://www.cdc.gov/nchs/data/nvsr/nvsr67/nvsr67_05.pdf
[Danes of age 70+ had a COVID IFR of 5.4% (5400 per 100,000 infections)] — Available: Kaspersen KA, Hindhede L, Boldsen JK, Mikkelsen S, Vestergaard LS, Berthelsen AN, Moustsen-Helms IR, Holm DK, Nilsson AC, Sækmose SG, Sørensen E, Harritshøj LH, Aagaard B, Hjalgrim H, Lillevang ST, Jørgensen CS, Krause TG, Ullum H, Pedersen OBV, Ostrowski SR, Erikstrup C. Estimation of SARS-CoV-2 Infection Fatality Rate by Age and Comorbidity Status Using Antibody Screening of Blood Donors During the COVID-19 Epidemic in Denmark. J Infect Dis. 2022 Jan 18;225(2):219-228. doi: 10.1093/infdis/jiab566. PMID: 34788834; PMCID: PMC8689980. https://www.ncbi.nlm.nih.gov/pmc/articles/PMC8689980/