

COVID Jabs a Fountain of Youth?
COVID Jabs a Fountain of Youth?
The "Elixir effect" as a spurious artifact of institutionalized misclassification

In this Substack, death rates among non-elderly adults in England among those unjabbed tracked better with jab rates than COVID case rates — suggesting that, as some in an age group get jabbed, it causes other people in that age group to die.
Instead of jabs causing others to die, as the data indicate, it is more likely that UK health officials are misclassifying deaths. Hard evidence would prove they did so if it was found that those who were jabbed had “miraculous” monthly survival rates (extremely-low death rates).
Here is evidence of that:
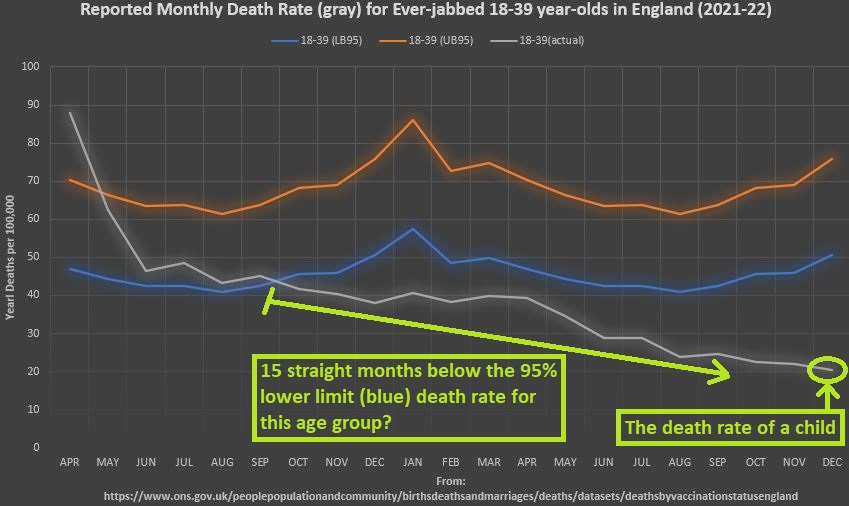
The blue and orange lines represent conservative lower and upper bounds on death rates among those under age 40 (no central estimate is provided in this graph). The gray line is what the Office of National Statistics (ONS) released regarding deaths for those ever-jabbed.
To get the 95% confidence limits, these narrow-band age group mortality rates were combined until they matched the ONS age bands:
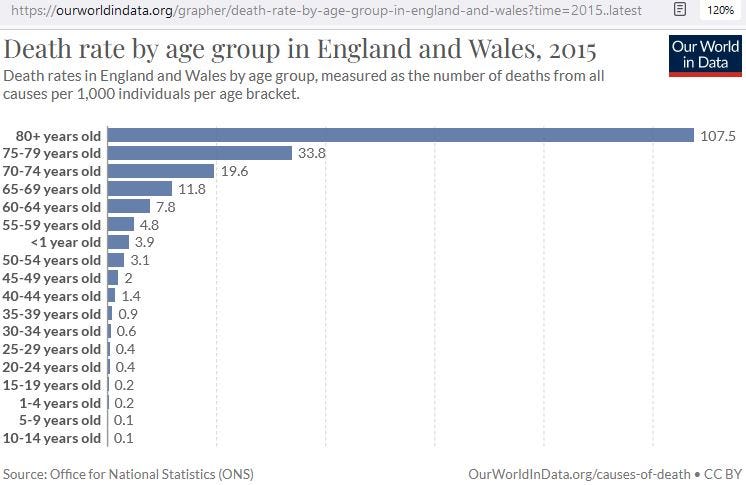
Using the narrow-band age-breakdown of the US population to estimate the narrow-band share in each total ONS age band, CDC’s 95% confidence multipliers (when X=99) were applied to the weighted average death rate which resulted.
Seasonal-adjustment was then applied by using the mean monthly share of death from 2013-2019 to develop a seasonality index.
Evidence from the temporal association of jab rates and death rates among the unjabbed vs. the jabbed indicates that UK health officials have been engaging in systematic misclassification of deaths (counting jabbed deaths as unjabbed ones).
This evidence-grounded systematic misclassification would have the effect of making the disease appear more deadly than it is, and of making the COVID jab appear more safe than it is.
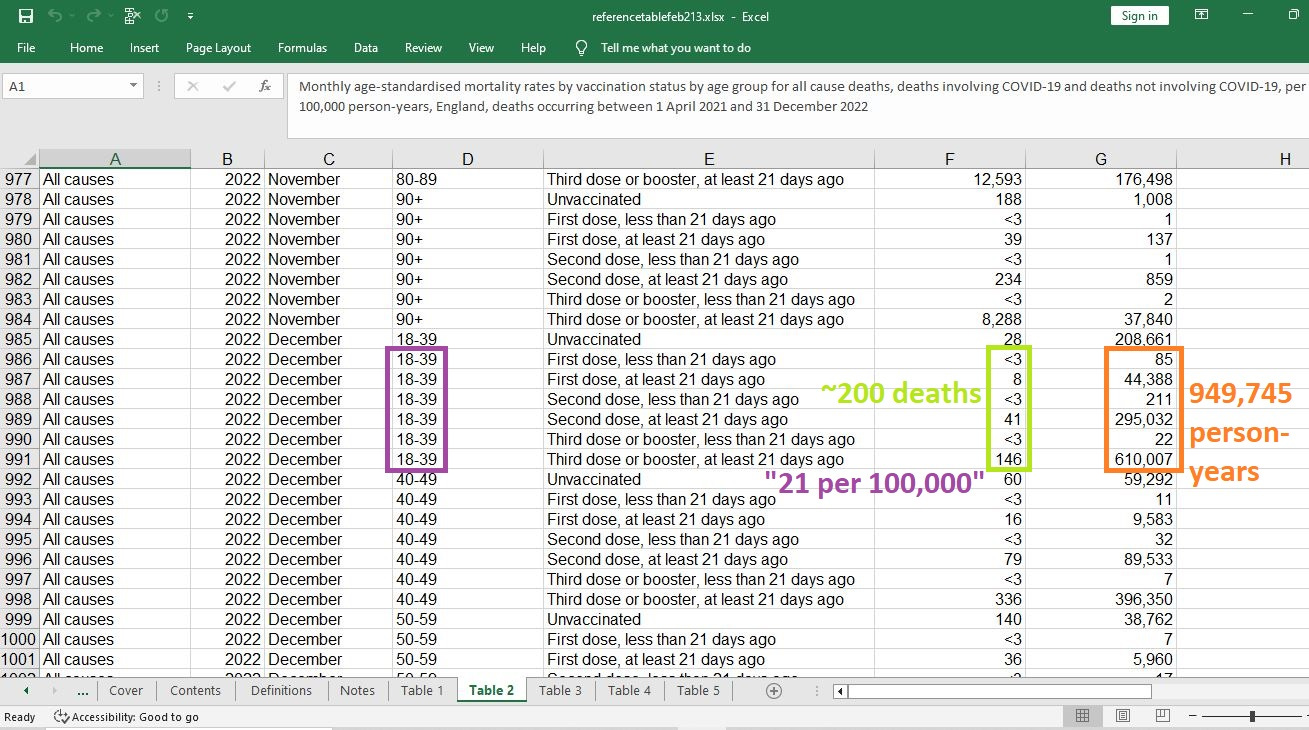
Here is the original file from ONS showing “child-like” death rates in young adults in December of 2022:
[click to enlarge]
Reference
[age-specific deaths by jab status in England] — ONS. Deaths by vaccination status, England. Table 2, columns F (death counts) and G (person-years). https://www.ons.gov.uk/peoplepopulationandcommunity/birthsdeathsandmarriages/deaths/datasets/deathsbyvaccinationstatusengland