

COVID v. Jabs: Risk of Hospitalization
COVID v. Jabs: Risk of Hospitalization
Head-to-head Risk Assessment

An important question to know the answer to is this one:
Which is more likely to put you into the hospital: COVID or the COVID jab?
In an attempt to answer it, I combined researched from a half-dozen studies. To get the risk of hospitalization due to COVID, you need to know 3 things:
total of those hospitalized who are positive for COVID
fraction of those “hospitalized positives” who are hospitalized because of COVID
fraction of the entire population who have ever been COVID positive
Once you know all 3 things, finding the risk of a COVID hospitalization — given a COVID infection — is easy. The overall risk of a COVID hospitalization in general will be somewhat lower than the risk in those infected, depending on the yearly attack rate (the fraction of the population infected each year).
The overall risk in general will be lower than the risk that reported below (for the hospitalization risk, once infected).
An Upper Bound on the number who are “COVID-hospitalized”
While the number of hospital patients positive for COVID by 18 Nov 2020 had reached 906,849 — removing the “obviously not due to COVID” patients would give an upper bound of those hospitalized “because of” COVID. After the obvious cases get removed, you’d still sift through and remove more, but I didn’t do that here.
After the obvious cases get removed, you have 333,430 hospitalizations suspected as being due to COVID (because of not being due to major, obvious diseases). But how many total COVID positive people had there been in the USA by 18 Nov 2020?
Risk of a “COVID-hospitalization”
You can’t use the estimate of confirmed cases to estimate the total number of COVID positives, because confirmation thresholds vary and have changed over time, making them non-objective (and therefore, non-useful). One obvious change over time is the number of tests performed.
More tests = More (discovered) cases
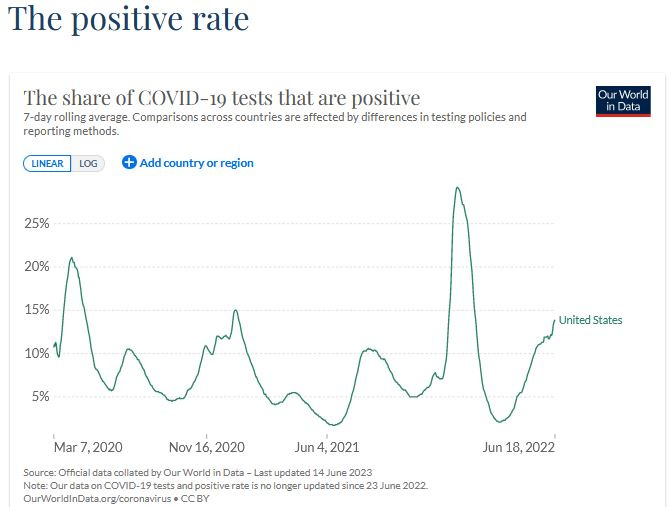
Instead of relying on a non-objective number like “confirmed cases,” I chose to extrapolate from the percentage of all tests that came back positive.
If 332 million Americans exist during one month of observation — and, in that month, 10% of the tests came back positive — then 33.2 million “apparent infections” happened that month.
If it happened 10 months in a row, then that is 332 million “apparent infections.” Here’s the timeline of the percentage of all tests which came back positive.
Two adjustments were made to the positivity rate to make it more realistic:
1.8% were removed each month, to account for carryover (people staying positive)
22.6% were removed each month, to account for false positives
By mid-November, the estimated cumulative COVID infections had reached 200 million. When applied toward the quick estimate of COVID hospitalizations (333,340 by 18 Nov 2020) — that’s one hospitalization for every 601 COVID infections.
Here are the notes on it:

[click to enlarge]
At left is the average postivity for the months in 2020. In column J is the monthly US population size. Column K is the crude estimate of monthly new COVID infections before adjustments. Column N is the fully-adjusted, cumulative COVID infection count.
Risk of Hospitalization from being Jabbed
When researchers went back through the serious adverse events (serious AE) for Pfizer’s Phase III clinical trial, they discovered one hospitalization (every serious AE involves hospitalization) for every 556 recipients of COVID jabs.
Even if jabs were 100% effective at preventing hospitalization due to COVID, by this estimate, you’d get hospitalized due to adverse events before you had a chance to prevent one single COVID hospitalization.
That’s negative efficacy though.
Critics & Detractors
Critics and detractors will likely chime in about how even Omicron, at least at first, had only a 43% attack rate — making my estimate of 200 million US COVID infections by 18 Nov 2020 (a 60% attack rate) out to be “unrealistic.”
But two rejoinders are that north Brazil had a 76% attack rate in October 2020 and Denmark had a 66% attack rate for Omicron. If a capital of a northern state in Brazil can have an attack rate of 76%, then how come the USA cannot have one at 60%?
Even if the number of US COVID infections is cut in half to 100 million by 18 Nov 2020, then by the time you have prevented a COVID hospitalization with jabs, you’ve also caused one (due to jabs).
That’s still zero effectiveness.
Even worse is the report that at least 4.4% of those taking jabs need medical care. When that is true, then it means that at least 2% of those taking jabs (1 in 50) are hospitalized — using a previous breakdown showing that 46% of those who need medical care for adverse events need hospitalization.
And besides, the risk of COVID hospitalization has dropped by so much now that it washes out the difference. Any way that you look at it, jabs are not a productive measure to implement (they do not lead to a net reduction in hospitalization).
Reference
[46% of all who get AEs severe enough to require medical care require at least extended hospitalization (if 4.4% require care, then 2.02% require hospitalization)] — BMJ. Contribution of adverse events to death of hospitalised patients. https://bmjopenquality.bmj.com/content/8/1/e000377
[over 4.4% of all who get Dose 2 of mRNA (or higher) require medical care] — Wang Y, Zhang Y, Zhang M, Zhang X, Li H, Wang Y, Wang W, Ji J, Wu L, Zheng D. The prevalence of adverse reactions among individuals with three-dose COVID-19 vaccination. J Infect Public Health. 2023 Jan;16(1):125-132. doi: 10.1016/j.jiph.2022.12.004. Epub 2022 Dec 6. PMID: 36516647; PMCID: PMC9724502. https://www.ncbi.nlm.nih.gov/pmc/articles/PMC9724502/
[1 serious AE per 556 vaccine recipients in Pfizer trial] — Fraiman J, Erviti J, Jones M, Greenland S, Whelan P, Kaplan RM, Doshi P. Serious adverse events of special interest following mRNA COVID-19 vaccination in randomized trials in adults. Vaccine. 2022 Sep 22;40(40):5798-5805. doi: 10.1016/j.vaccine.2022.08.036. Epub 2022 Aug 31. PMID: 36055877; PMCID: PMC9428332. https://www.ncbi.nlm.nih.gov/pmc/articles/PMC9428332/
[66% attack rate of Omicron] — Erikstrup C, Laksafoss AD, Gladov J, Kaspersen KA, Mikkelsen S, Hindhede L, Boldsen JK, Jørgensen SW, Ethelberg S, Holm DK, Bruun MT, Nissen J, Schwinn M, Brodersen T, Mikkelsen C, Sækmose SG, Sørensen E, Harritshøj LH, Aagaard B, Dinh KM, Busch MP, Jørgensen CS, Krause TG, Ullum H, Ostrowski SR, Espenhain L, Pedersen OBV. Seroprevalence and infection fatality rate of the SARS-CoV-2 Omicron variant in Denmark: A nationwide serosurveillance study. Lancet Reg Health Eur. 2022 Oct;21:100479. doi: 10.1016/j.lanepe.2022.100479. Epub 2022 Aug 5. PMID: 35959415; PMCID: PMC9355516. https://www.ncbi.nlm.nih.gov/pmc/articles/PMC9355516/
[2 in 3 COVID hospitalizations were obviously not due to COVID] — O'Hearn M, Liu J, Cudhea F, Micha R, Mozaffarian D. Coronavirus Disease 2019 Hospitalizations Attributable to Cardiometabolic Conditions in the United States: A Comparative Risk Assessment Analysis. J Am Heart Assoc. 2021 Feb;10(5):e019259. doi: 10.1161/JAHA.120.019259. Epub 2021 Feb 25. Erratum in: J Am Heart Assoc. 2021 Apr 6;10(7):e020858. PMID: 33629868; PMCID: PMC8174244. https://www.ncbi.nlm.nih.gov/pmc/articles/PMC8174244/
[1.8% of people can stay positive for more than a month] — Eser F, Kayaaslan B, Güner R, Hasanoğlu I, Kaya Kalem A, Aypak A, Akinci E. The Effect of prolonged PCR Positivity on patient Outcomes and Determination of Isolation period in COVID-19 patients. Int J Clin Pract. 2021 May;75(5):e14025. doi: 10.1111/ijcp.14025. Epub 2021 Jan 23. PMID: 33449410; PMCID: PMC7995230. https://www.ncbi.nlm.nih.gov/pmc/articles/PMC7995230/
[when triple-checked, PCR gave false positives at least 22.6% of the time] — Braunstein GD, Schwartz L, Hymel P, Fielding J. False Positive Results With SARS-CoV-2 RT-PCR Tests and How to Evaluate a RT-PCR-Positive Test for the Possibility of a False Positive Result. J Occup Environ Med. 2021 Mar 1;63(3):e159-e162. doi: 10.1097/JOM.0000000000002138. PMID: 33405498; PMCID: PMC7934325. https://www.ncbi.nlm.nih.gov/pmc/articles/PMC7934325/
[76% in Manuas got COVID by Oct 2020] — Buss LF, Prete CA Jr, Abrahim CMM, Mendrone A Jr, Salomon T, de Almeida-Neto C, França RFO, Belotti MC, Carvalho MPSS, Costa AG, Crispim MAE, Ferreira SC, Fraiji NA, Gurzenda S, Whittaker C, Kamaura LT, Takecian PL, da Silva Peixoto P, Oikawa MK, Nishiya AS, Rocha V, Salles NA, de Souza Santos AA, da Silva MA, Custer B, Parag KV, Barral-Netto M, Kraemer MUG, Pereira RHM, Pybus OG, Busch MP, Castro MC, Dye C, Nascimento VH, Faria NR, Sabino EC. Three-quarters attack rate of SARS-CoV-2 in the Brazilian Amazon during a largely unmitigated epidemic. Science. 2021 Jan 15;371(6526):288-292. doi: 10.1126/science.abe9728. Epub 2020 Dec 8. PMID: 33293339; PMCID: PMC7857406. https://www.ncbi.nlm.nih.gov/pmc/articles/PMC7857406/