Edit: This post has a procedural error in it, and there is an update of it here. Apologies.
Of all places on Earth, Sweden is the best place to make comparisons of COVID to other pandemics. That’s because, of all places on Earth, Sweden exercised some of the least mitigation measures. This gives data on what the disease is capable of doing, without the confounding measures implemented by so many other nations.
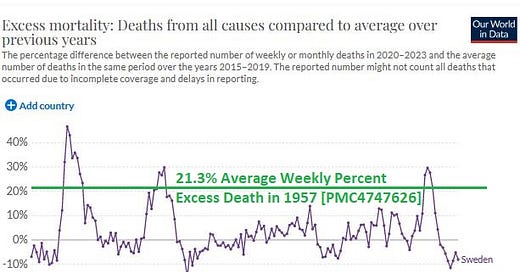
When estimating excess death from flu, a conservative measure is to only use respiratory deaths. When that conservative measure was applied to excess death in Sweden in 1957, the annual excess death was 21.3%. Here is how it looks when overlayed on the more granular chart of weekly excess death in Sweden during COVID:
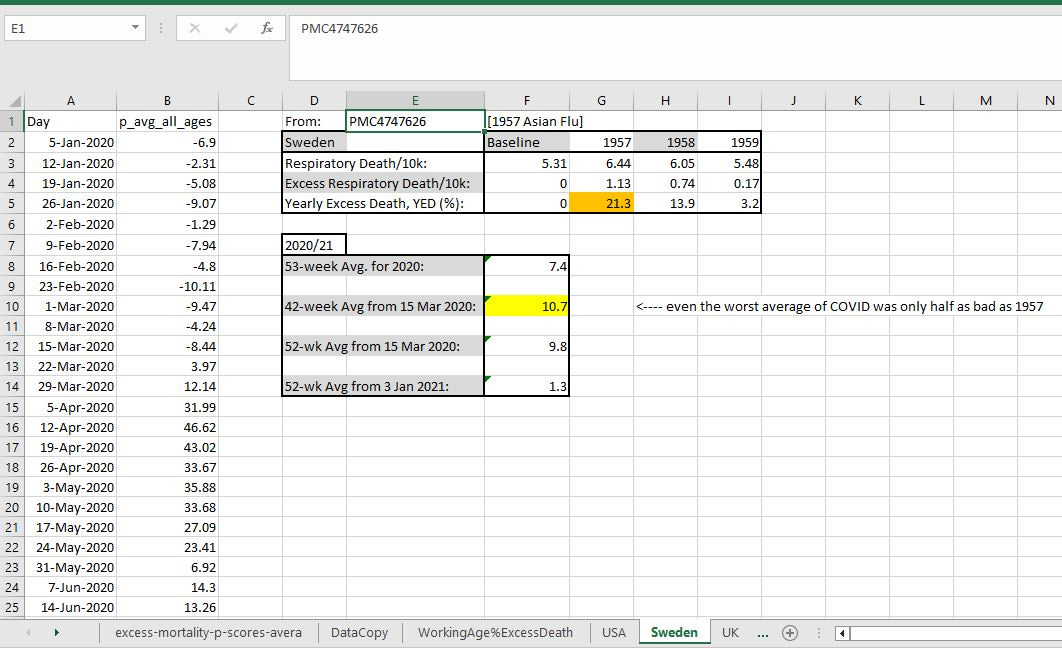
But if the purple weekly excess death line were to be averaged like the green line for 1957 Asian Flu is averaged, it’d be lower than the green line (COVID wasn’t as deadly as Asian Flu). How much lower? Well that depends on your starting point. Here are 4 estimates of average weekly excess death to relate to the 52-week average of 1957:
[click to enlarge]
In the best place to study it (Sweden) and with one of the most-conservative measures to use (excess respiratory deaths), COVID was only half as bad as the 1957 Asian Flu. Because COVID was only half as bad as the 1957 Asian Flu, it was not necessary to bypass normal procedural safeguards in vaccine development.
We could have performed proper safety investigations to obtain years of safety data.
Reference
[P-scores using 5-year average baseline] — OWID. https://ourworldindata.org/excess-mortality-covid
[Sweden excess for 1957 was 21.3%; data supplement] — Viboud C, Simonsen L, Fuentes R, Flores J, Miller MA, Chowell G. Global Mortality Impact of the 1957-1959 Influenza Pandemic. J Infect Dis. 2016 Mar 1;213(5):738-45. doi: 10.1093/infdis/jiv534. PMID: 26908781; PMCID: PMC4747626. https://www.ncbi.nlm.nih.gov/pmc/articles/PMC4747626/


