

Daily Excess Deaths per Million (DEDpM)
Daily Excess Deaths per Million (DEDpM)
Nine estimates providing perspective

In the USA in 2020, it had been expected for there to have been an average of 24 daily deaths for every million U.S. citizens. Daily excess death per million can be shortened up to just “DEDpM.”
Because of COVID, we ended up with about 28 daily deaths per million, which would give an annual average daily excess death per million of 4.0 (DEDpM).
That’s almost 17% excess death for that year.
For vital perspective, look at these daily excess death per million values alongside each other:
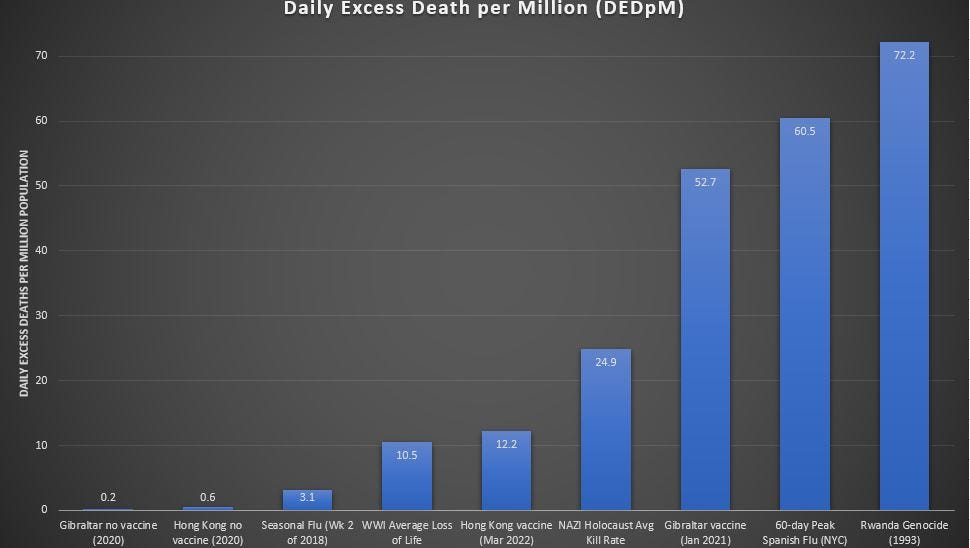
The lowest daily excess death per million was Gibraltar before the vaccines rolled out, when there was a paltry 0.2 DEDpM there. Hong Kong before vaccines was also doing well, at 0.6 DEDpM — which was 5 times better than the worst week of seasonal flu (Week 2 of 2018) in the USA.
After vaccines rolled out in Hong Kong, daily excess deaths per million surpassed the 4.5-year average death of World War I, but at least it didn’t approach the multi-year average kill rate of the NAZI Holocaust.
Gibraltar wasn’t so lucky.
After giving 38 arm jabs for every 100 people living in Gibraltar (by the end of January 2021) (possibly the fastest-ever vaccine rollout), the January 2021 daily excess death per million reached 52.7 DEDpM.
Evidence suggests that COVID vaccines have at least the potential to cause short-lived death rates higher than the multi-year average kill rate of the NAZI Holocaust, which itself is much higher than the average rate of loss of life in World War I.
Reference
[Gibraltar and Hong Kong Excess Death per Million Before and After Vaccine Rollout] — OWID. https://ourworldindata.org/excess-mortality-covid
[Genocide in Rwanda in 1993] -- World Bank Crude Death Rate. https://data.worldbank.org/indicator/SP.DYN.CDRT.IN?locations=RW
[Annualized 0.91% kill rate of Holocaust (Germany + Occupied Europe)] — DEMOCIDE: NAZI GENOCIDE AND MASS MURDER. 20,946,000 Victims: Nazi Germany 1933 To 1945. By R.J. Rummel. Available: https://hawaii.edu/powerkills/NAZIS.CHAP1.HTM
[16,543,185 died over 4.5 years of fighting, from nations whose sum total of population was 960 million] — World War I casualties. Available: https://www.census.gov/history/pdf/reperes112018.pdf
[Mean death rate across time and conditions prior to 1914 was 19.15 per 1000, but coming down over time] — The Decline in Infant and Overall Death Rates, 1878-1913: The Role of Early Sickness Insurance Programs. Available: https://www.fsb.muohio.edu/fsb/ecopapers/docs/bowblijr-2008-04-paper.pdf
[The world crude death rate of 1960 — 17.71 per 1000 — is likely a reasonable estimate of pre-1914 death] — World Bank crude death rate. Available: https://data.worldbank.org/indicator/SP.DYN.CDRT.IN
[Worst 61 days of the Spanish Flu in New York City] — Faust JS, Lin Z, Del Rio C. Comparison of Estimated Excess Deaths in New York City During the COVID-19 and 1918 Influenza Pandemics. JAMA Netw Open. 2020 Aug 3;3(8):e2017527. doi: 10.1001/jamanetworkopen.2020.17527. Erratum in: JAMA Netw Open. 2020 Sep 1;3(9):e2021496. PMID: 32789512; PMCID: PMC7426746. https://www.ncbi.nlm.nih.gov/pmc/articles/PMC7426746/