

NOTE: This post was inspired by a “lecture” at MIT given by Steve Kirsch. Although Prof. Fenton and Igor Chudov have unanswered questions about the data set.
The M.O.A.R. (mother of all revelations) video on Rumble is a reporting of deaths after COVID shots in New Zealand. Here is a screenshot:

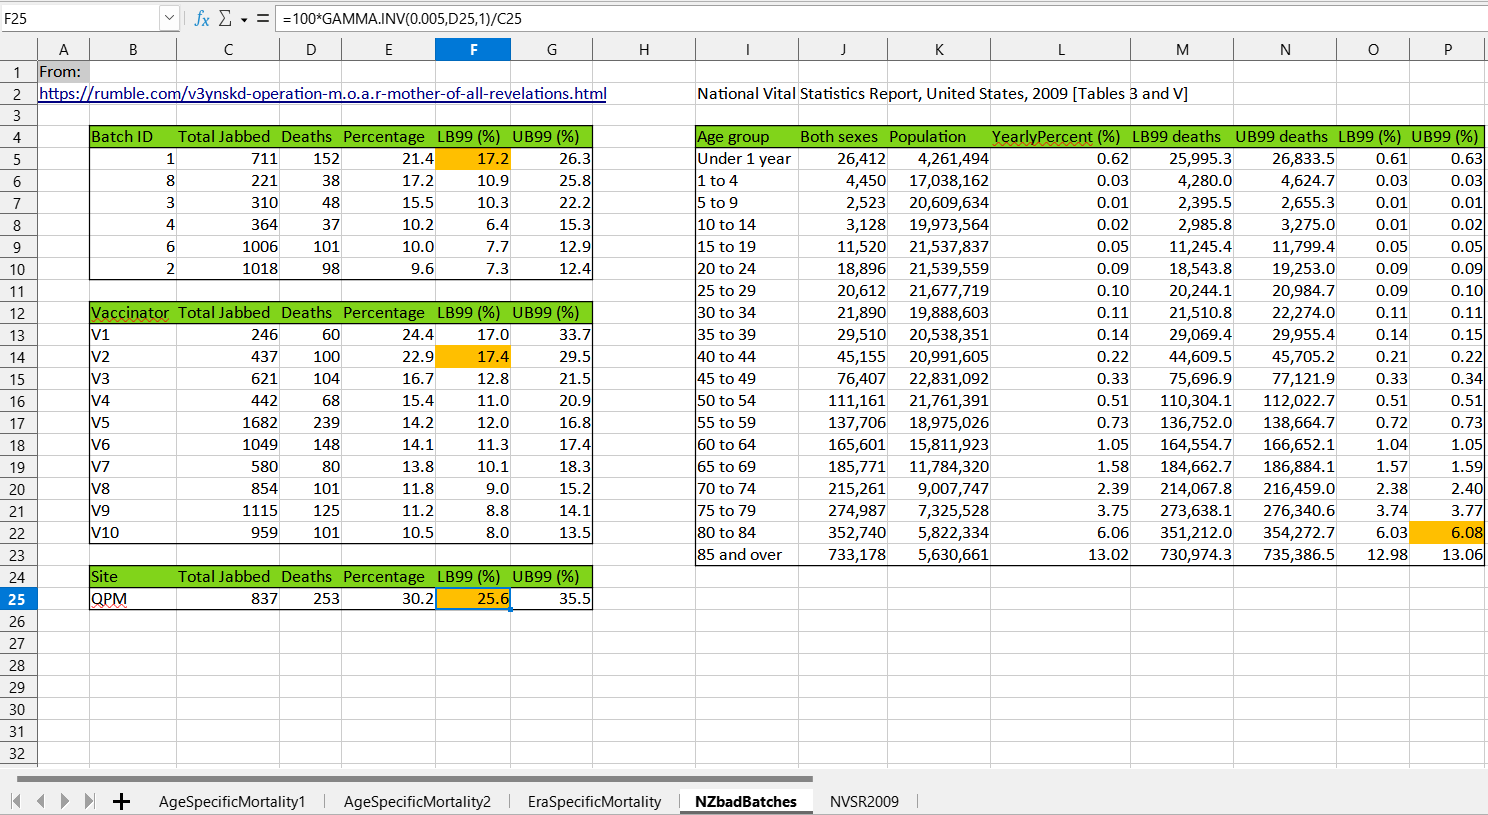
In this screenshot, batches were tracked and the deaths after COVID shots were high.
Because these alarming death percentages indicate a mass casualty event from taking COVID shots, here is an analysis of the range of death percentages which are consistent with the data to 99% confidence:
[click to enlarge]
In cell F5, showing batch #1 given out, the lowest plausible post-jab death rate (99% lower bound) which is consistent with New Zealand death records is 17.2%.
Perspective: Comparison to a “worst-case” expectation
For perspective, cell P22 at bottom right shows the hypothetical expectation of yearly death had it been the case that 100% of New Zealand jab recipients were from age 80 to 84 — an assumption that is so generous that it can be referred to as a “worst-case.”
In other words, the “highest-ever” death rate that you would expect to occur in a mixed population is 6% (the death rate of the highest “narrow age-band”). Yet certain batches in New Zealand led to a death rate almost triple that “highest-ever” expected rate.
The middle-left table shows different sites which administered COVID shots and there is a 99% lower bound which is also over 17% death. Cell B25 at bottom left refers to Queens Park Medical - Outreach located way down in Invercargill at the south end of New Zealand.
The death rate after COVID shots there was over 4 times the highest-ever death rate that you would expect.
The Poisson probability for 253 deaths in the 837 jab recipients, given the overly-generous assumption that all of the 837 recipients were from age 80 to 84 (expectation = 6% = 50 deaths), would be 8.0 * 10^-55. Here is the probability in long form:
0.00000 00000 00000 00000 00000 00000 00000 00000 00000 00000 00008
Time Window
Though the expected death rate is from the USA and for exactly one year, it was not clear from the Rumble video how long the follow-up of jab recipients was when their rate was computed.
Even still, you cannot “normally” find a death tally which is quadruple the expected yearly death inside of the time-window — even if you extend it up to the present day, as the absolute maximum length of the time-window for these New Zealand deaths is still less than 3 years long; and more-likely less than 2 years long (and may be even less than 1 year long).
Reference
[highest “narrow age-band” death rate] — CDC. 2009 National Vital Statistics Report. Tables 3 and V. https://www.cdc.gov/nchs/data/nvsr/nvsr60/nvsr60_03.pdf
[M.O.A.R. video] — Rumble. https://rumble.com/v3ynskd-operation-m.o.a.r-mother-of-all-revelations.html