Direct count of ICU Admits in Phase III trial
Post #514
In previous installments, the average weekly rate of ICU admissions per million during 2020 was estimated indirectly from the two mRNA phase III trials. Those indirect estimates ran from about 9.5 up to 20.8 weekly ICU admissions per million.
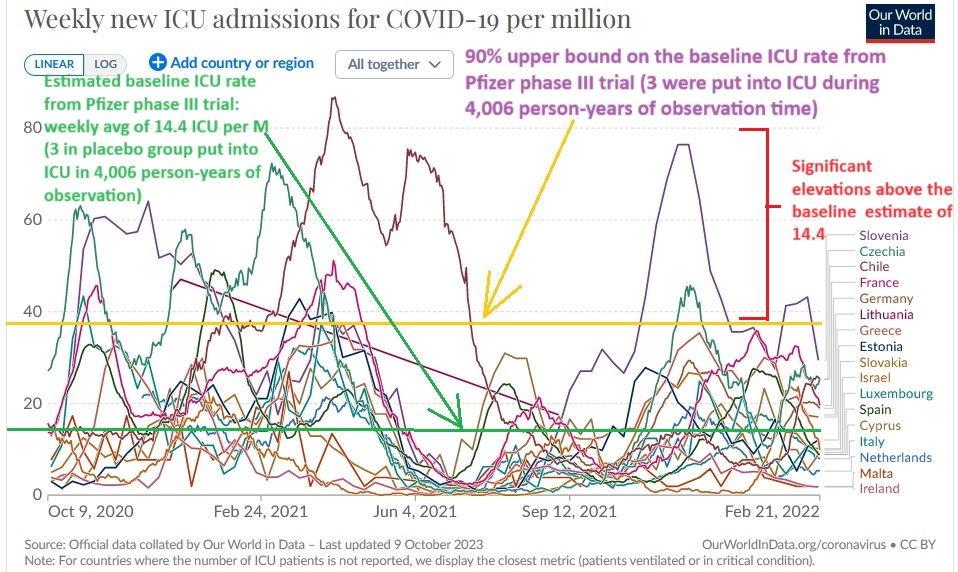
But the Pfizer phase III trial actually reported ICU admissions. There were 3 of them in the placebo group during 4,006 person-years of observation time.
When converted to an average weekly rate per million, that comes out to 14.4 weekly ICU admissions per million. Here is how that baseline rate compares to 17 nations after they rolled out their COVID jabs:
A few nations spent a lot of consecutive weeks above the 90% upper bound of the baseline rate of ICU admission, indicating that COVID jabs had increased the baseline risk of ICU admission (from where it was in 2020).
How to independently verify the upper bound
The Gamma Method preferred by the CDC was used in order to find the 90% upper bound on the count of people put into ICU (i.e., 7.75 people). Here is the code you could put into a spreadsheet in order to verify it:
=GAMMA.INV(0.95,3+1,1)
If divided into 4,006 person-years of observation time, you get 1.9 put into ICU per 1,000 person-years. When converted to an average weekly rate per million, you get 37.2 per million person-weeks (the height of the yellow line in the graph).
Reference
[weekly ICU admissions per million] — OWID. https://ourworldindata.org/grapher/weekly-icu-admissions-covid-per-million
[in 4,006 person-years of observation time in the placebo group, 3 were sent to ICU] — FDA document. https://www.fda.gov/media/144245/download


