

Ed Dowd and his partners at Phinance Technologies have analyzed data on the recent crisis in medical conditions, disabilities, and deaths. This substack will look at the UK data on disability claims (PIP: personal independence pension). Graphs are taken directly from the Phinance Technologies site, but colored notes have been added each time.
Overall Claims for Disability (cleared)
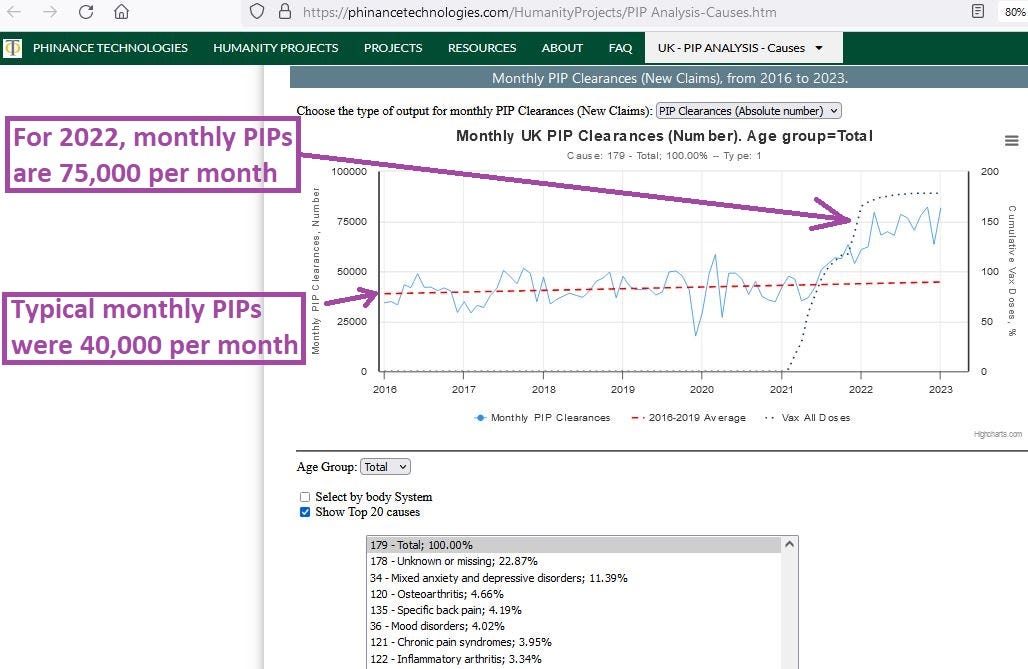
From the prior years with about 40,000 claims per month, with a subtle upward trend, total claims in 2022 were almost double what was expected. Because the variation seen in prior years tells you something about the probability of witnessing large deviations (using the Z score), here is that graph:
Overall Claims (Z score)
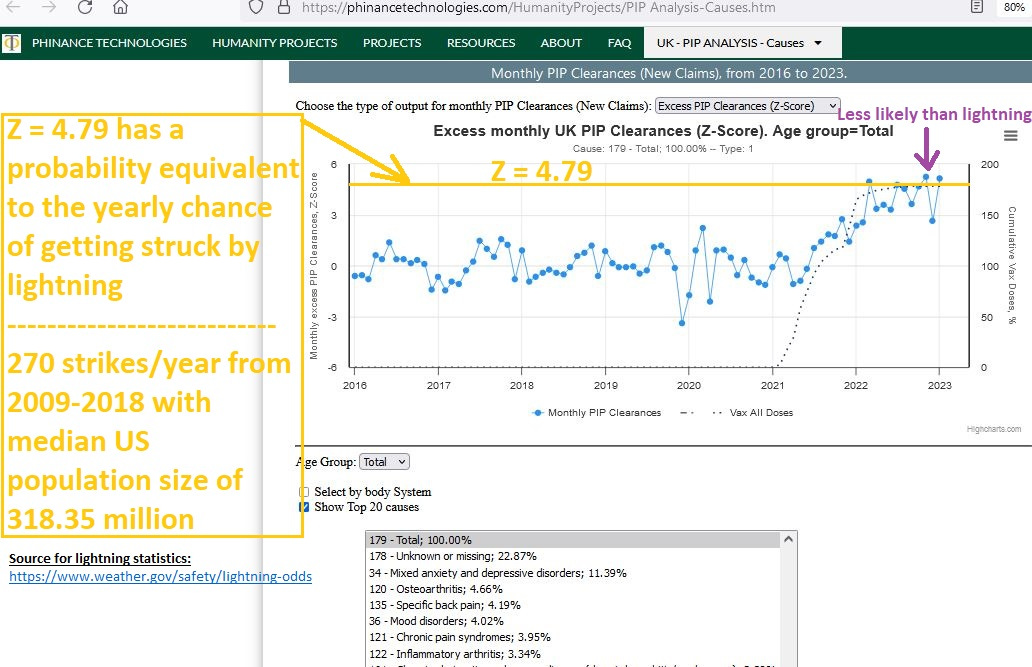
To give perspective, when data are normally distributed, then the probability of a Z score as high as (or higher than) Z = 4.79 is equivalent to the yearly chance to be struck by lightning — which is somewhat less than 1 chance in a million.
Notice how there were several monthly claims which were that far above trend, so that the chance of seeing them all together in one year is equivalent to the same person being struck by lightning in the same year six different times.
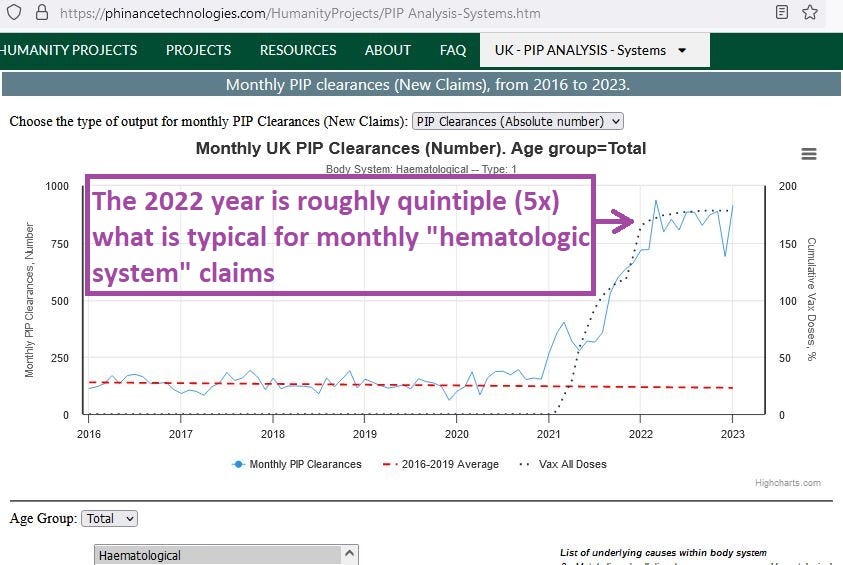
The body system related to the disability claim was also relevant, and the claims based on the hematological system (circulation, blood, etc.) rose by at least five-fold:
Claims based on Hematological System
The probability of this being due merely to random variation in the numbers was so low that it “broke” Excel when I was trying to find it (Excel wasn’t powerful enough):
Hematological Claims (Z scores)
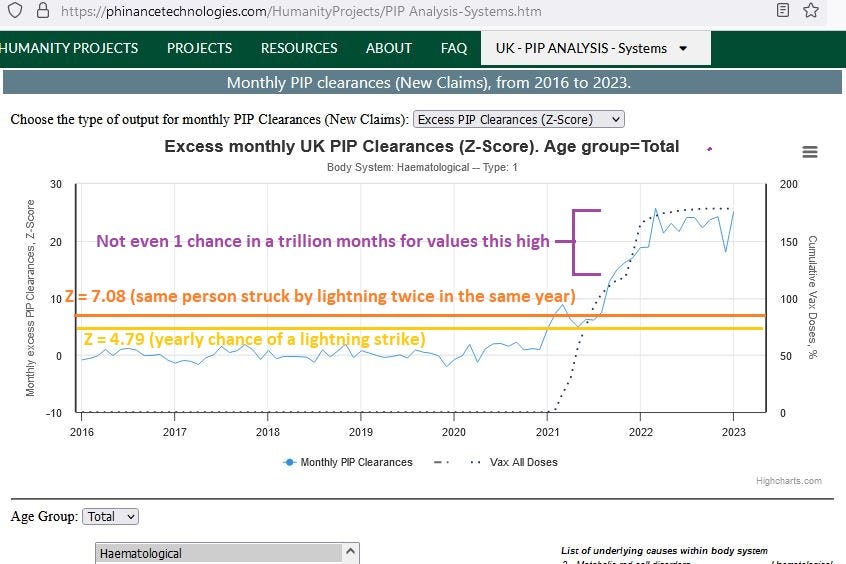
The deep orange line represents the Z score associated with the probability of the same person being struck by lightning twice in the same year (Z = 7.08). Notice how all of 2022 was beyond that. Here are some top single causes of disability claims:
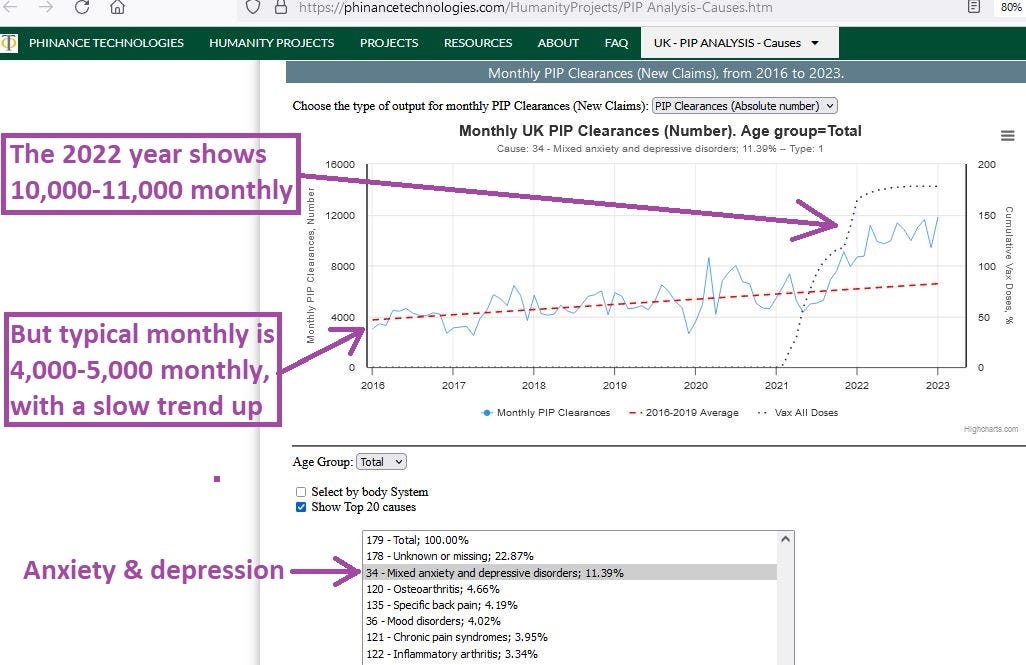
Anxiety & Depressive Disorders
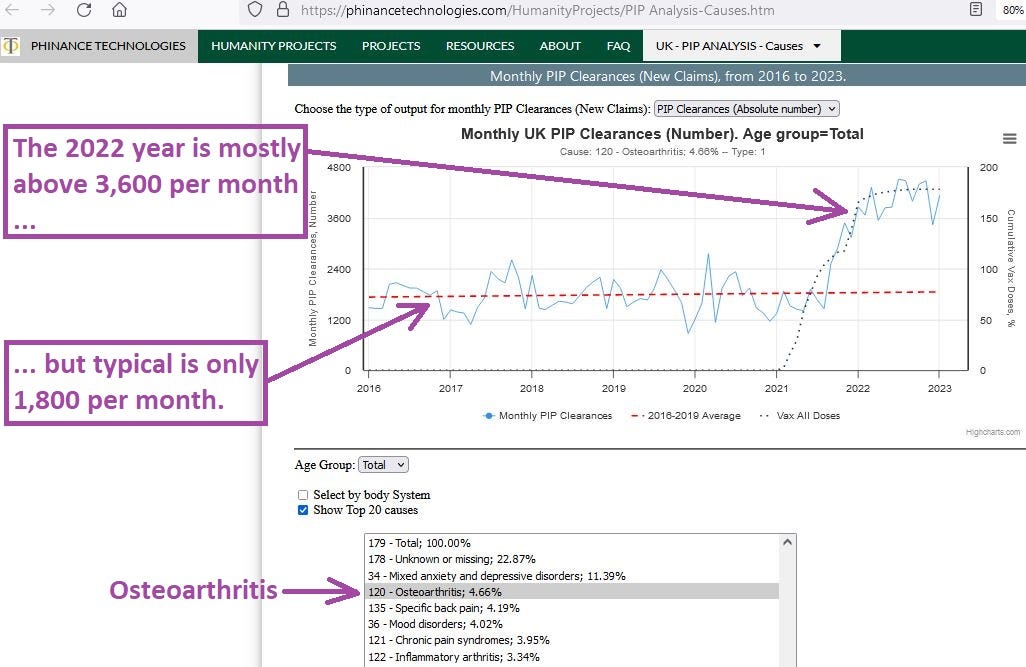
Osteoarthritis
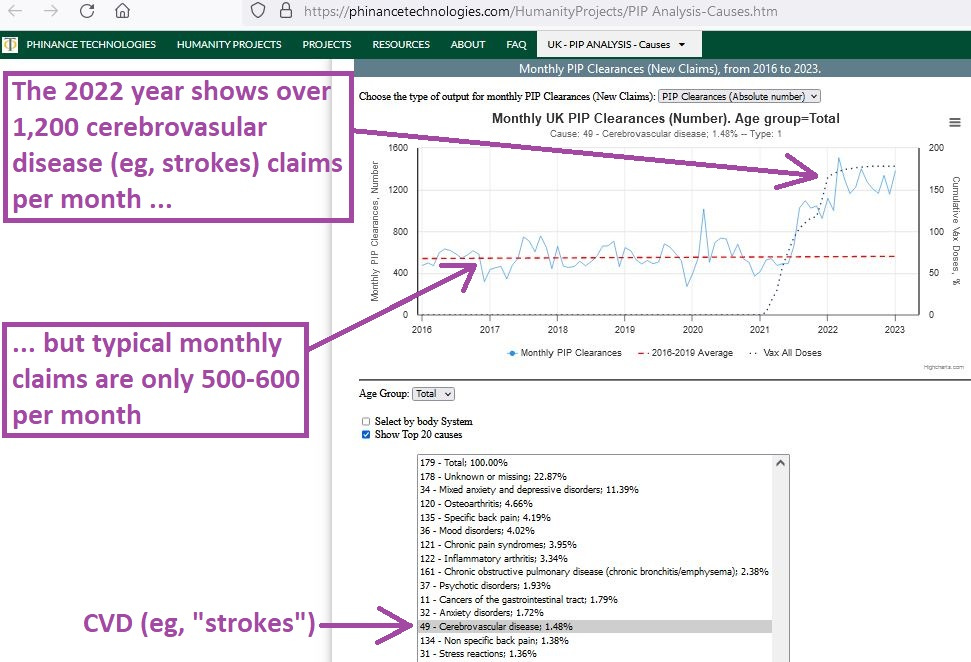
Cerebrovascular Disease (eg, strokes)
Injuries
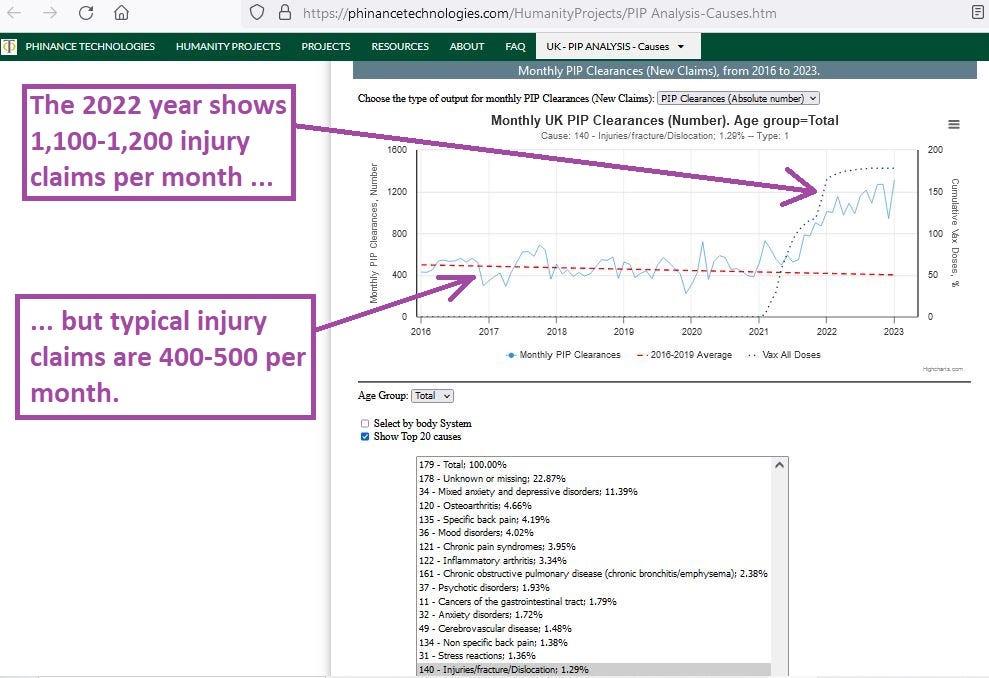
These four of the top “single causes” all approximately doubled in 2022, leading to many thousands of “excess” claims each month — with a monthly excess for anxiety and depression of about 5,000 each month (60,000 excess claims per year) from that one cause, alone.
These figures are astonishing, and the overlay of COVID jab uptake levels reveals a striking association with the increased disability. As Ed Dowd recently stated in a CHD segment, “They can’t run from this data.”
Reference
[Ed Dowd appearance on CHD] — Children’s Health Defense. Good Morning CHD. https://live.childrenshealthdefense.org/chd-tv/shows/good-morning-chd/ed-dowd-they-cant-run-from-this-data/
[the data aggregation and analysis site] — Phinance Technologies. https://phinancetechnologies.com/Home.asp
Because a lot of these adverse events are happening months after the jabs, no one is joining the dots. This is how they will get away with the slow kill.