

Early Economic Growth vs. Now

Opportunities for making a better life for yourself and your family used to be more pervasive than they are today. Imagine being a plumber back in 1893, and being able to afford this car:

Not only that, imagine being able to afford a house and an acre of land, to boot — all on a plumber’s salary (though you may have to skip going out for dinner in fancy restaurants).
Before influence of collective bargaining (labor unions), worker pay at least appeared to stagnate, being $13.90 a day working as a farm-hand in 1870, or $1.57 an hour in a non-farm job:
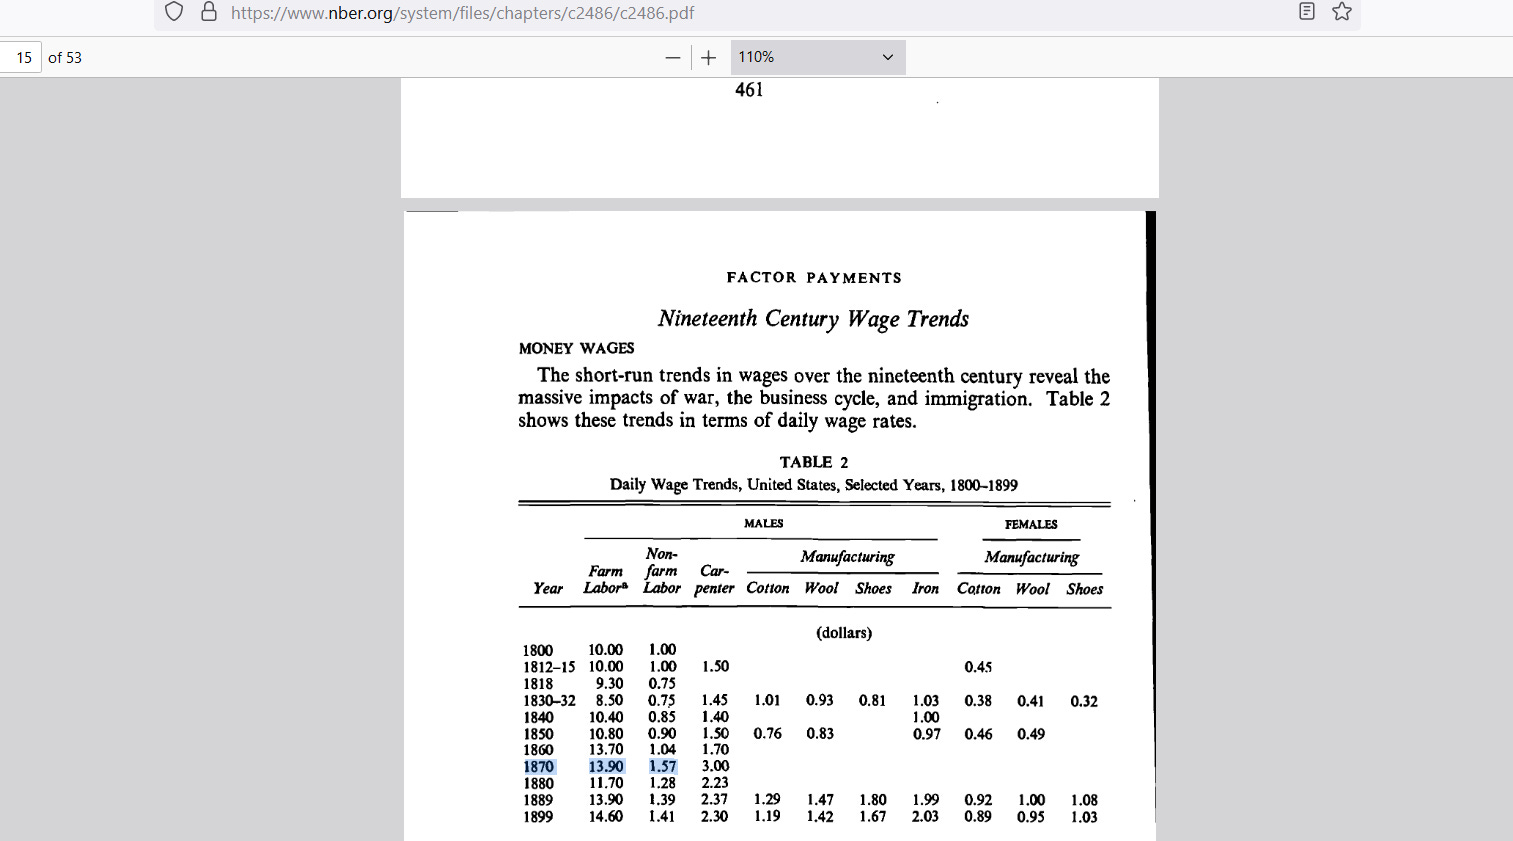
Notice how farm pay appears not to increase very much by 1899, only going up to $14.60 a day, and how non-farm pay appears to actually have gone down. Anti-capitalists claim that, in the absence of labor unions, the free market was driving worker pay down.
But is it true?
If you compare the prices of 1870 to the prices of 1899, you get the whole story. Wages get their use from being able to buy things, things that have price-tags on them. If prices fall faster than wages, then your paycheck buys more than before (equivalent to a pay-raise under constant pricing). The Consumer Price Index (CPI) of 1870 was 141:
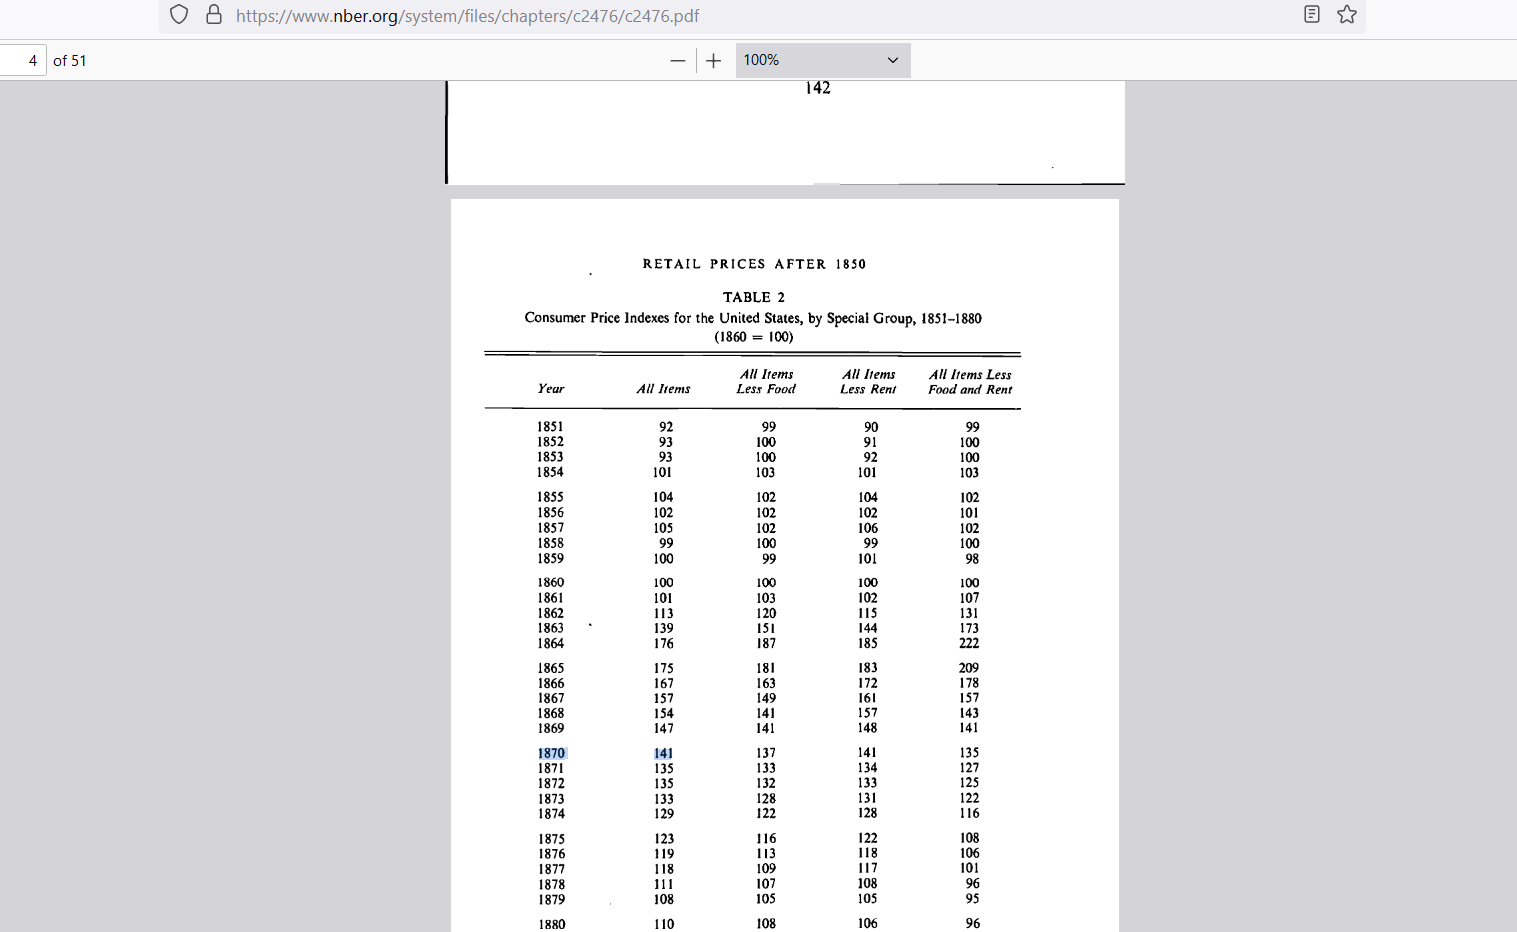
But by 1899, the CPI had fallen to 94:
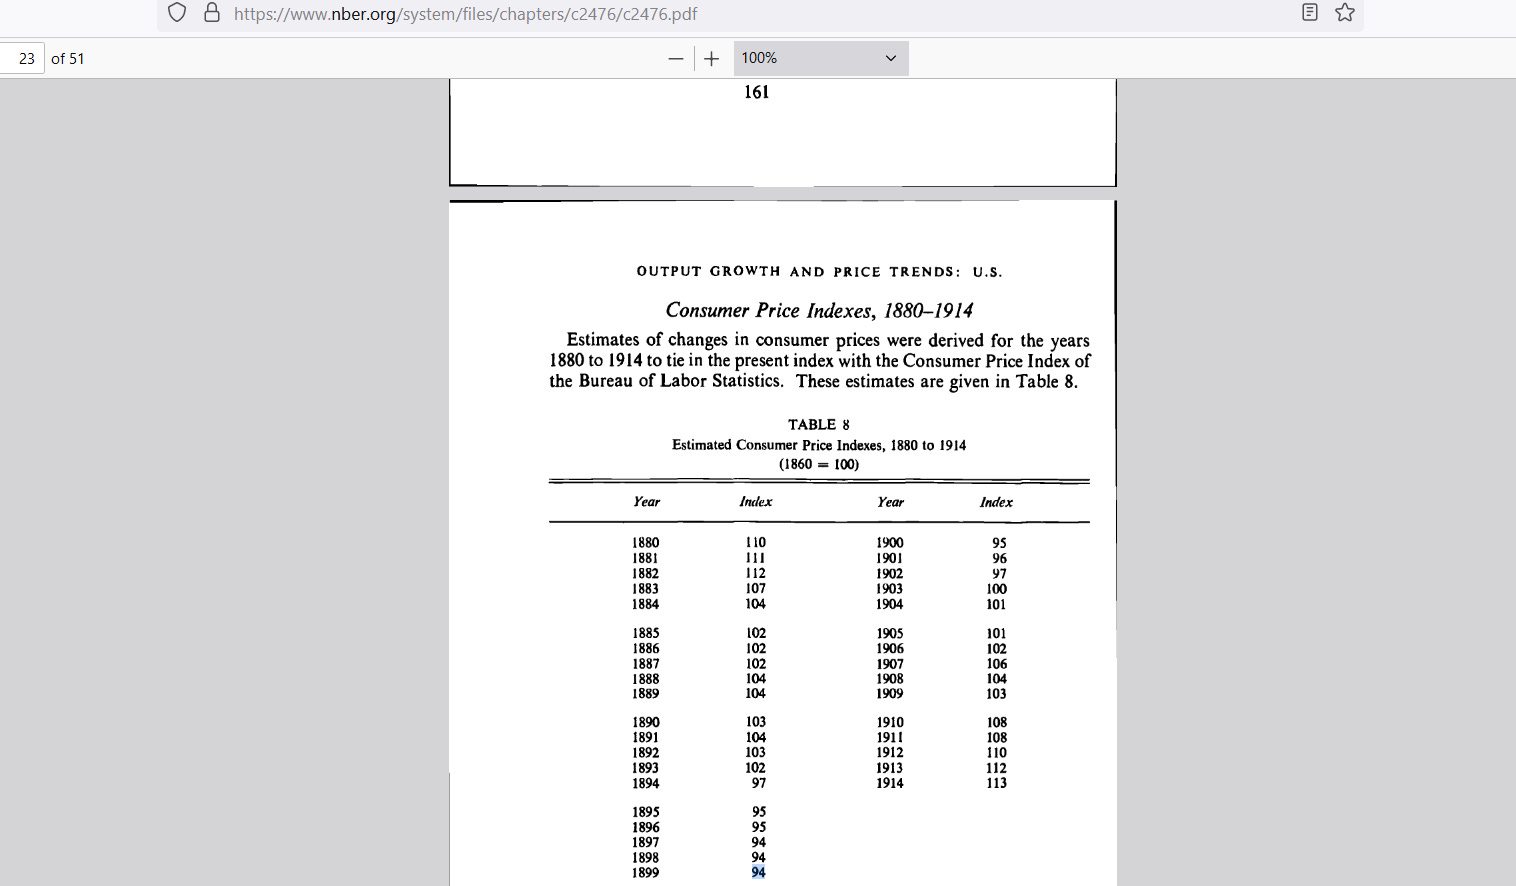
In other words, prices had fallen by a third from 1870 to 1899 — making people more able to buy things. Combining farm pay with non-farm pay, the free market was causing real wages to rise by 1.3% a year — so that, every 54 years, your paycheck buys twice as much stuff.
Returning to our plumber of 1893, a comparable plumber in 1947 could buy two cars, two houses (one main house and one vacation home), and two acres of land. A comparable plumber of 2001 could buy four cars, four houses (one main house and 3 vacation homes) and four acres of land.
But something happened along the way. Real plumbers back in in 2001 could not afford to buy 4 homes. This means that real wage growth stopped growing by 1.3% a year like it had been doing under a free market, back when there was very little influence of labor unions.
Compound growth is very illuminating regarding the true economics of our era.
If opportunities were so high before, so high that plumbers would be able to afford multiple vacation homes, then where did they go? Some of the problem is that people got comfortable enough to stop worrying about the future. But most of the problem is that free market principles have been progressively violated as time went on.
Under economic freedom, investors demanded, and received, over 7% real annual gains:
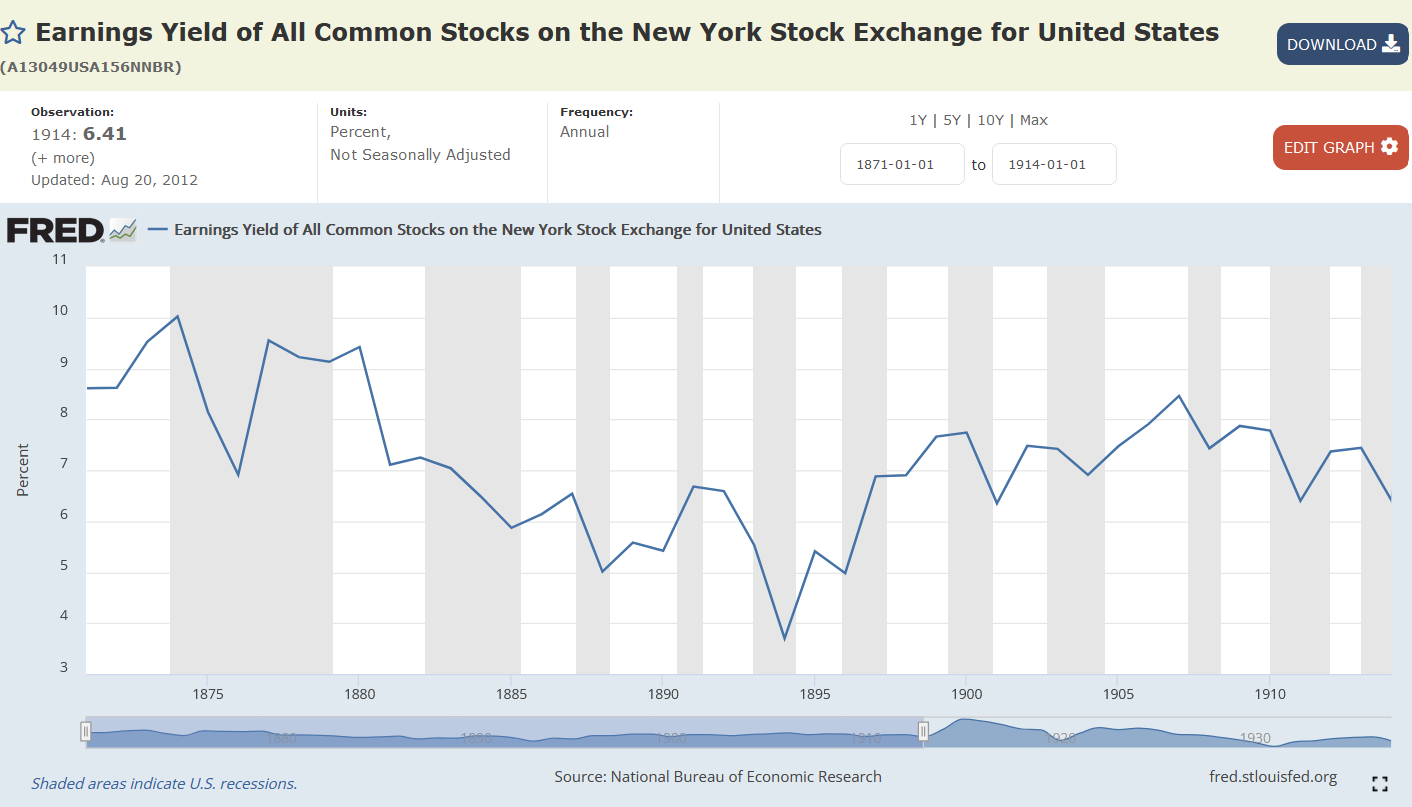
That part at left where nominal annual gains dropped from 10% a year, down to settle at just over 7% a year, corresponded to that period of time when prices dropped by a third. Though the overall economy only grew at an average of 5% a year, investors take a premium (they get more reward for taking the risks). Their average is higher than 5%.
A breakdown may be like this:
Annual Total growth = 5% a year
————————————————————————————
Annual Labor supply growth = 1.5 of that 5%
Annual Wage growth = 1.3 of that 5% (total wages = 2.8 of that 5%)
Annual Business Profit = 2.2 of that 5%
Notice how business profit growth is being estimated at about 78% as high as growth in “total wages paid.” But, because business owners and investors are a smaller group than wage-laborers, their personal annual percentage gains are higher than 5% a year (even though 56% of annual GDP growth went back into the pockets of workers).
This next graph doesn’t actually sum to 100% because it mixes spending items with income items to find the relative share of resource allocation by workers, business, and government. The net operating surplus (business profit; green) was 78% as much as total wages paid out (purple) in 1929:
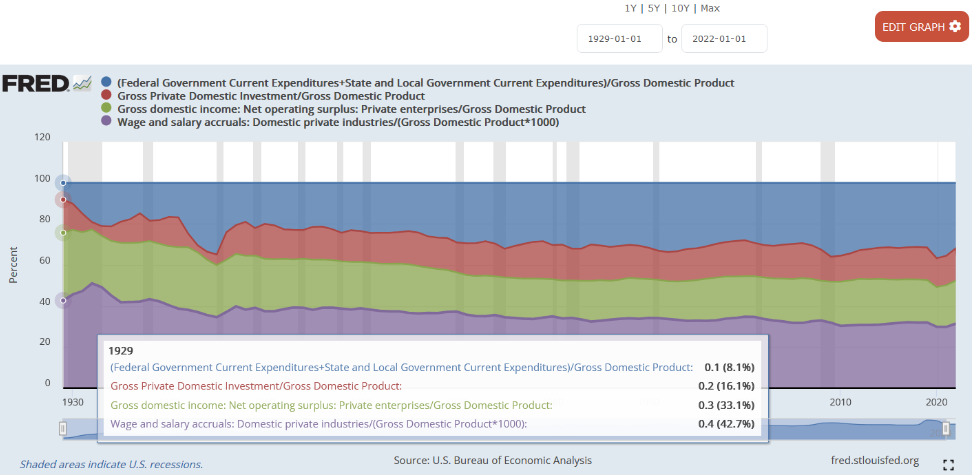
But that’s when total government spending (blue) was less than 9% of GDP. Government only allocated (disposed of) 8 cents of every dollar of produced wealth back then. Private citizens controlled 92 cents of every dollar they produced, resulting in efficient resource allocation due to how decentralized it was back then.
Private investment (red) was twice as high as total government spending, so that private investors had at least twice as much “say” over where the produced dollars of wealth would be applied for future growth.
After government grew, too much resources were being allocated centrally, crowding out the wage share of GDP — which caused real GDP growth to fall below 5% a year due to lost “allocative efficiency” — eroding the opportunities for everyday people:
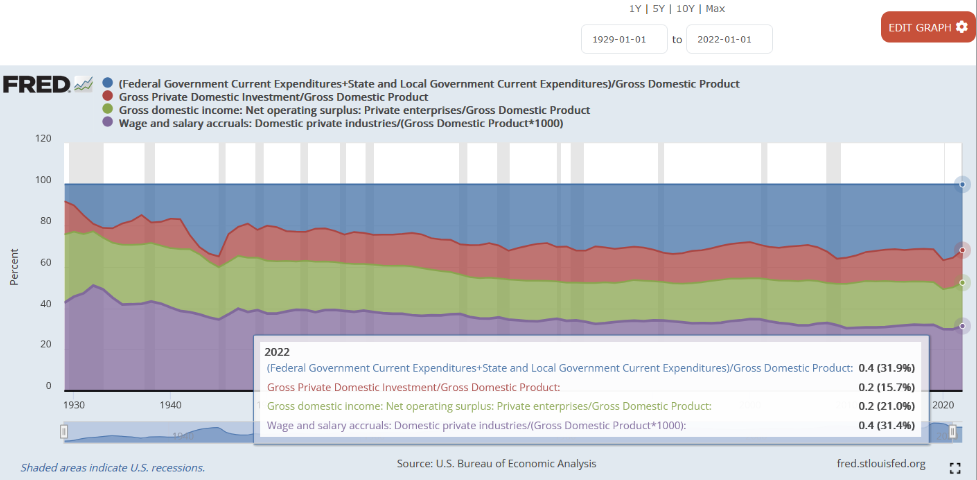
In 2022, government spending was shamefully still higher than the sum total of all wages paid out. To make America the Land of Opportunity once again, government must shrink. But those behind the Great Reset want to see government grow, restricting the opportunities of regular people even more.
Just “Say No!” to the Great Reset, and instead demand from your politicians that they agree to downsize the government.
Reference
[1929 manufacturing was 26 times higher than 1863, for a 66-year, average annual manufacturing growth rate of 5% (with no 5-yr decline, ever)] — National Bureau of Economic Research, Index of Manufacturing Production for United States [A0107AUSA322NNBR], retrieved from FRED, Federal Reserve Bank of St. Louis; https://fred.stlouisfed.org/series/A0107AUSA322NNBR