

Evolving COVID Lethality raises Questions
Evolving COVID Lethality raises Questions
In-depth view of the changes in COVID lethality over time

Infectious diseases like COVID do not remain the same over time, but change in approximately-predictable ways based on the principles of epidemiology. One general trend is that viruses, especially RNA viruses like SARS-CoV-2, mutate into less virulent strains or variants, and — when they are RNA viruses — they do so in less than one year’s time.
Note: Some of the expected waning of lethality is due to naturally-acquired immunity, or even reduction in number of susceptibles who had low natural immunity, but this essay focuses more on the waning of lethality that is due to mutations into less-lethal variants.
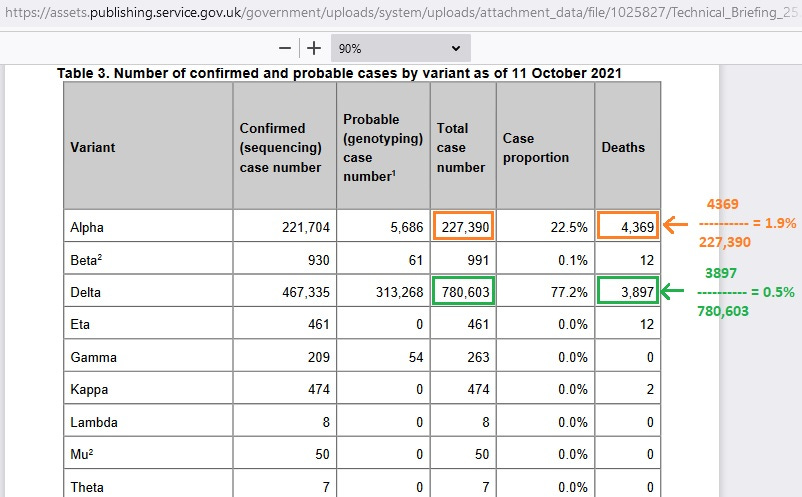
Evidence from the UK bears this out, as shown in their Technical Briefing #25, where an early variant, Alpha, had a case fatality rate of about 1.9% but a later variant, Delta, had a case fatality rate of about 0.5% — with Delta variant having just over a fourth of the lethality of the Alpha variant.
This steep drop in COVID lethality is not due to naturally-acquired immunity (such as when a population reaches herd immunity) — but is due to mutation, instead — as the number of Delta infections is more than 3 times higher than the number of Alpha infections.
Herd immunity doesn’t explain the steep drop in COVID lethality and the best explanation is that COVID, itself, was becoming less deadly. Herd immunity may even be variant-specific (E.g., herd immunity to Alpha, but still “herd-susceptible” to Delta).
[orange and green markings added]
The “rates” in orange and green above are cumulative, so that if you had high death at the start, it takes a lot of “much lower death” to bring the rate down. Rates specific to time-points or time-windows can be found to be much lower if high initial death occurred, as we are about to see below.
The time-specific picture of COVID lethality in the UK for just the end of December 2020 and spilling over into the beginning of January 2021 (Technical Briefing #5) reveals that COVID was, in a statistical sense, no longer more deadly than flu*, as is shown in analysis of 30,000+ COVID cases all of whom had been followed over time for 28 days so as to record any deaths:
[orange markings added]

NOTE: Nomenclature is important and the word “case” here is being used simply for representing “known positive status” — rather than the medical definition of a case, where a case is a person with symptoms of a disease (and not just one who tested with positive status for a disease).
Data from CDC for flu seasons from Fall 2012 to Spring 2019, excluding the 2017/18 flu season, give a median case fatality rate of about 0.13% — yet the case fatality rate from the 51 deaths out of 30,494 COVID cases in the UK was 0.17%.
*In a statistical sense, the variability in case fatality for flu in the US would prevent this noted 0.04% of difference in case fatality rates from reaching statistical significance. For example, for the 2014/15 season, CDC reports 30,165,452 flu infections and 51,376 deaths, for a case fatality rate of 0.17% for that flu season [addendum: my next SubStack post dives into symptomatic case fatality rate and infection fatality rate of this flu season].
That lethality for flu is the same as the COVID lethality found in the UK in January 2021. Other data cited in the references at bottom show the hospital death rate for COVID patients was falling during 2020, even reaching below a crude estimate of median hospital death rate for flu (divide CDC flu deaths by CDC flu hospitalizations).
But the original strain of COVID — sometimes called the “wild-type” or the “Wuhan-1” strain — likely had more lethality than that found in the first round of UK data in January 2021. At the time of analysis, Alpha had already displaced the wild-type.
It was analyzed at a time before Alpha variant had been displaced by less lethal variants of COVID, and they used S-gene target failure (SGTF) to identify Alpha variant. Their first analysis (the one reported here) showed no difference in lethality from the non-Alpha variants included in the analysis at that time.
But their follow-up on 19 Jan 2022 revealed higher death among the Alpha (SGTF) cases, leading to a case fatality rate of 0.2% for Alpha variant, and only 0.1% for non-Alpha variants of COVID — which is a death rate that is less than the median of 6 flu seasons (0.13%).
Brought together in an Excel spreadsheet
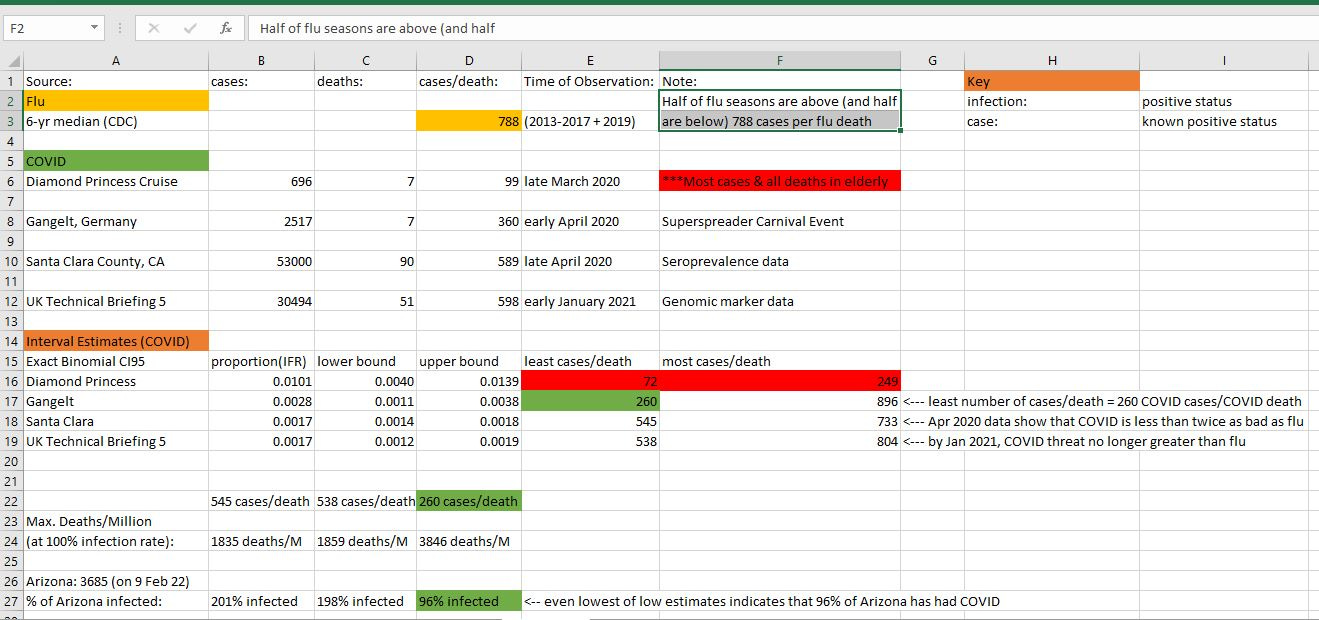
Four sources of data were compiled in an Excel spreadsheet, all giving an estimate of COVID lethality. The first source was the February outbreak on the Diamond Princess Cruise Ship, where the evacuation report revealed 696 COVID infections, and the most plausible death data revealed 7 deaths — all among the elderly.
Other, and higher, estimates of death from the February outbreak exist, such as from the WHO, but those estimates all violate expectations regarding the time-to-death probability distribution. Most COVID deaths occur within a month of symptom onset, just like when those 7 deaths did.
A few deaths, reported a full 2 months after symptom onset, would lead to a sample of COVID deaths from the Diamond Princess which is too improbable to be plausible.
A good model for COVID time-to-death is a lognormal distribution with raw mean of 17 days and raw standard deviation of 9.4 days — both being the CI95 upper bound estimates from Linton et. al. (which is cited below ).
The depicted density curve below is more stretched out than the distribution for the raw death data, because the upper bounds were used instead of the point estimates on the mean and standard deviation. This helps correct for any selection bias from basing your model only on those patients who had shorter-than-average incubation times.

Another data source was from a superspreader event in Gangelt, Germany, where the most corrected estimate on COVID prevalence was virtually 20% of the entire population of Gangelt. There were 7 total COVID deaths recorded at the time, from an estimated 2517 COVID infections.
Another source was from a seroprevalence study in Santa Clara County, California, where an estimated 53,000 COVID infections led to approximately 90 deaths. The final source of data is the UK Technical Briefing #5 mentioned above, where just over 30,000 COVID infections led to 51 deaths.
The reciprocal (1/x) of the case fatality rate would show you the number of cases required in order to see one death. It would let you merely look at just the death counts for COVID, and then be able to estimate the fraction of the population with COVID infection.
One upper and lower limit of plausibility on this “COVID cases/COVID death” ratio would be derived from the upper and lower bounds on a CI95 interval around the proportion of deaths from the number of original cases.
A CI95 interval was formed (bottom of Excel image) around all four of the estimates of COVID lethality, it is noted at bottom that some US states have reported such high COVID death that it implies that up to 96% of their population has had COVID by now!
An alternate explanation is that US states which are reporting COVID deaths per million which are so high that they would actually imply a near-total COVID prevalence in their state, would be that the state agencies reporting those astronomically-high rates are “lying.”
As you can tell from the Excel file, the lethality of COVID appeared to drop over time, just as you would expect from the principles of epidemiology. Diamond Princess data are marked in red, because the unique population aboard the Diamond Princess — half were elderly! — is not representative of any existing society.
With an unrepresentative sample like that, not much can be inferred back to the population at large, though you could still infer an elderly-only COVID case fatality from the Diamond Princess data.
A glossy, “big-picture” overview of the Evolving Lethality of COVID
A stylized chart showing the evolution of COVID lethality over time is below, and the standard against which it is measured is the median flu case fatality as shown in reciprocal (1/x) form in cell D3 of the Excel file (1 death / 788 cases = 0.13% case fatality for flu).
A first indication of relative lethality from COVID, as compared to flu, comes from the ~450 COVID infections among elderly on the Diamond Princess cruise ship, leading to 7 recorded deaths which were recorded in a time-frame that is still plausible from a “time-to-death” distribution for COVID deaths.
A “what if” analysis on ~450 flu infections in the elderly reveals that about 5 would die if 450 were infected with flu, meaning that those 7 COVID deaths represent a 40% increase in lethality beyond flu.
That sets the bar height at the far-left of the chart (150% of flu lethality was used in place of 140% though), with each successive bar’s height being related to the variant of COVID which came before it. The bar height for Omicron variant is the least certain of the four variants, and is the result of “guessing” from the least amount of data.
CAVEAT: It may be that Alpha variant wasn’t any more lethal than wild-type, but because some reports showed it as being approximately 50% more lethal, it was set higher to accomodate that. The 4-fold reduction of lethality from Alpha-to-Delta has the most data backing it up (the million UK infections of Technical Briefing #25).

Chart Note: The biggest drop in lethality above happened when Delta replaced Alpha as the dominant variant during the summer of 2021. By the end of the summer of 2021, COVID lethality had dropped by almost three-fourths — calling into suspicion any big rise in excess mortality (in any age group) from that point, going forward.
Here is a screenshot of the questionable COVID death rate in Arizona (Worldometers.info/coronavirus). Note how the reported deaths per million population in Arizona was mentioned at the bottom of the Excel file as being implausible based on the known lethality of COVID:
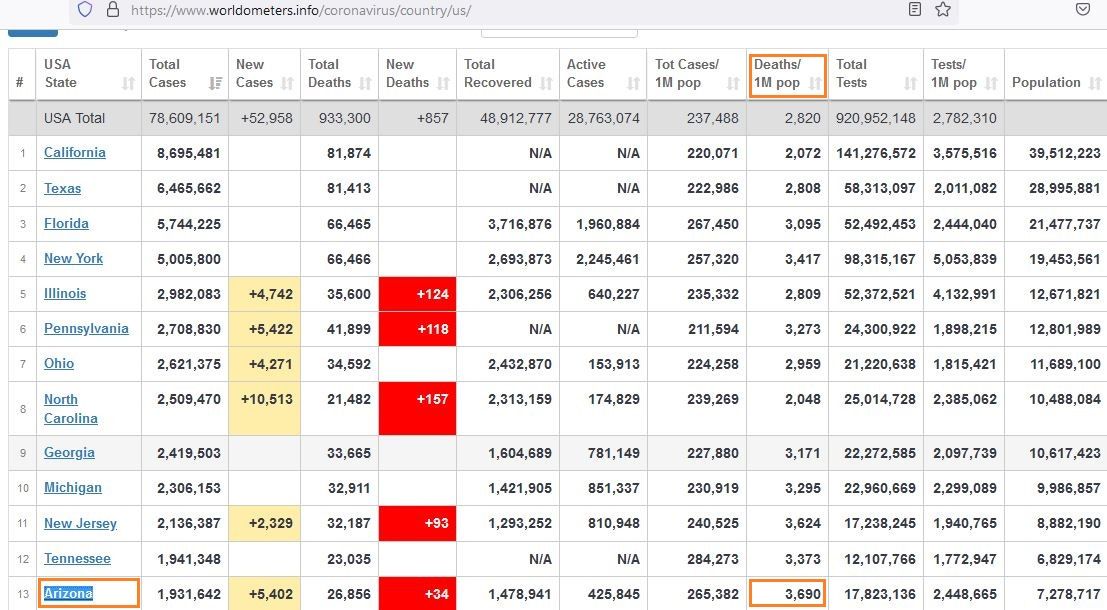
If the lowest plausible number of COVID infections required in order to be able to see one COVID death in a region is 260 COVID infections — as the Gangelt data show — then the minimum plausible COVID exposure can be found by multiplying the reported death rate by 260.
At 3690 COVID deaths per million, the minimum plausible cumulative rate of COVID infection in Arizona would be (3690 * 260) per million, or 959,400 COVID infections for every million people.
That’s 96% of their population though, which doesn’t seem right. There may be another reason for the death rate being so high, besides 96% of everyone having COVID, but I cannot think of another reason which is as consistent with the data.
Also of great concern is the fact that excess mortality among working-age Americans shot up in the US in late 2021 (OurWorldInData.org/excess-mortality-covid) — after the circulating COVID variants had become less lethal than flu (as the UK data had previously shown):
[orange markings added]
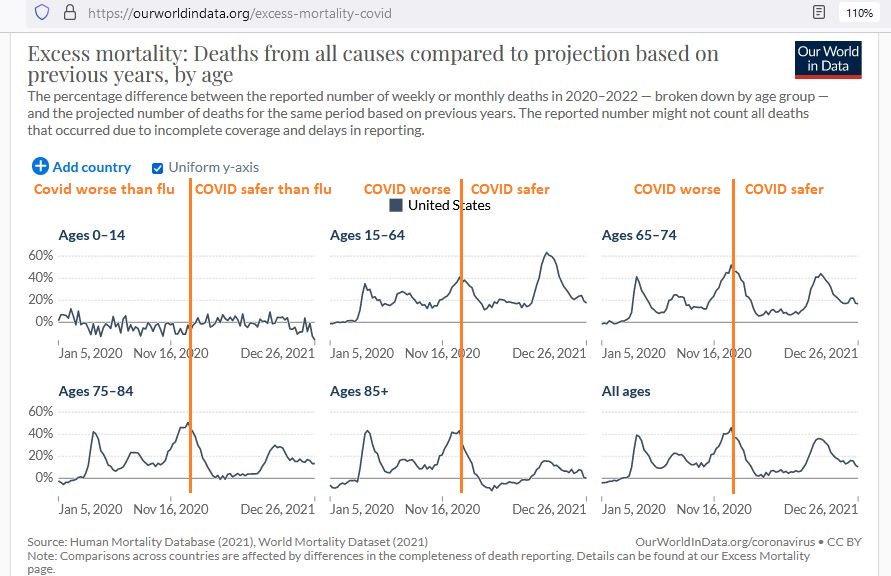
The orange divider line is supposed to represent mid-January, when the UK data had revealed that non-Alpha COVID variants (death rate 0.1%) were less lethal than flu — i.e., less lethal than the median of the 6 flu seasons (death rate 0.13%) mentioned above.
From Technical Briefing #5, it can be surmised that roughly 92,000 COVID infections, all of which were not of the Alpha variant, were following by UK health authorities, and that they led to approximately 92 deaths in total — for a final death rate of 0.1%.
92,000 people with COVID were followed through time, and 92 (0.1%) ended up dying. If 92,000 with flu were followed through time, about 120 (0.13%) would end up dying.
A late-2021 excess mortality rate of 60% among working-age Americans is very disturbing, especially because the evolution of COVID lethality does nothing to explain it. On a surface analysis, it appears that that highest-ever excess mortality is not due to COVID.
Hopefully some insight will be had from future investigation into this, as it is never good to see that much excess death when there isn’t an epidemiologic explanation for it.
In the week ending on 5 Sep 2021, about 53,000 were expected to die for the US overall — yet 73,000 did (an excess of almost 20,000). In the week ending on 12 Sep 2021, about 54,000 were expected to die — yet 73,000 did (an excess of over 19,000).
That’s 38,000 or so unexpected (excess) deaths in just a two-week window.
If COVID had become much less lethal by late 2021, as the UK data indicates that it had, then we have to look elsewhere to explain the “highest-in-the-entire-chart” excess death among working-age Americans.
Sweden provides an example of what the trend in excess death (reported - projected) should look like, given what is known about the waning COVID lethality after December of 2020 — when less-lethal variants were in the process of displacing all of the wild-type, “Wuhan-1” COVID.

Notice how it is that, even by the beginning of February 2021, excess deaths in Sweden had already zeroed-out — remaining near zero for the 12 months which followed.
For an entire year now, Sweden hasn’t had any demonstrable threat from COVID.
Their results fit perfectly with the evolution of COVID lethality but, disturbingly, results in many nations such as the US are inferior to what has been seen in Sweden.
Reference
[UK Technical Briefing #25.] Available from: https://www.gov.uk/government/publications/investigation-of-sars-cov-2-variants-technical-briefings
[UK Technical Briefing #5.] Available from: https://www.gov.uk/government/publications/investigation-of-novel-sars-cov-2-variant-variant-of-concern-20201201
[Past seasons CDC reports of flu infections and flu deaths.] Available from: https://www.cdc.gov/flu/about/burden/index.html
NOTE: The data for 2017/18 were not used due to suspicions of “data-doctoring” by the CDC. The CDC revised the numbers in 2021, three full years after that season had come and gone. The original numbers had shown that that flu season was actually worse than some estimates for COVID, until the CDC “went back in time” and revised the numbers.
[Diamond Princess breakdown of cases by age.] National Institute of Infectious Diseases in Japan. Available from: https://www.niid.go.jp/niid/en/2019-ncov-e/9417-covid-dp-fe-02.html
[Diamond Princess final evacuation report.] Anan H, Kondo H, Takeuchi I, Nakamori T, Ikeda Y, Akasaka O, Koido Y. Medical Transport for 769 COVID-19 Patients on a Cruise Ship by Japan Disaster Medical Assistance Team. Disaster Med Public Health Prep. 2020 Dec;14(6):e47-e50. doi: 10.1017/dmp.2020.187. Epub 2020 Jun 5. PMID: 32498735; PMCID: PMC7298096.
[“Time-to-death” probability for COVID.] Linton NM, Kobayashi T, Yang Y, et al. Incubation Period and Other Epidemiological Characteristics of 2019 Novel Coronavirus Infections with Right Truncation: A Statistical Analysis of Publicly Available Case Data. Journal of Clinical Medicine. 2020 Feb;9(2). DOI: 10.3390/jcm9020538. PMID: 32079150; PMCID: PMC7074197.
[WHO COVID-19 Situation Report #72 on 1 Apr 2020 showing 7 Diamond Princess deaths.] Available from: https://www.who.int/docs/default-source/coronaviruse/situation-reports/20200401-sitrep-72-covid-19.pdf
[WHO COVID-19 Situation Report #88 on 17 Apr 2020 showing 13 Diamond Princess deaths.] Available from: https://www.who.int/docs/default-source/coronaviruse/situation-reports/20200417-sitrep-88-covid-191b6cccd94f8b4f219377bff55719a6ed.pdf
NOTE: The binomial probability that 6 of 13 total deaths would show up after Day 50 (a time when only 1% of COVID deaths are expected) is just 1 in 61 billion. It is many, many times more likely that you will get hit by lightning this year, than that that final WHO estimate on Diamond Princess deaths is “legitimate.”
[COVID hospital death rate falling during 2020 to just 6.5%, which is below the median flu hospital death rate] Nguyen NT, Chinn J, Nahmias J, et al. Outcomes and Mortality Among Adults Hospitalized With COVID-19 at US Medical Centers. JAMA Netw Open. 2021;4(3):e210417. doi:10.1001/jamanetworkopen.2021.0417
[Superspreader Event in Gangelt, Germany.] Streeck H, Schulte B, Kümmerer BM, Richter E, Höller T, Fuhrmann C, Bartok E, Dolscheid-Pommerich R, Berger M, Wessendorf L, Eschbach-Bludau M, Kellings A, Schwaiger A, Coenen M, Hoffmann P, Stoffel-Wagner B, Nöthen MM, Eis-Hübinger AM, Exner M, Schmithausen RM, Schmid M, Hartmann G. Infection fatality rate of SARS-CoV2 in a super-spreading event in Germany. Nat Commun. 2020 Nov 17;11(1):5829. doi: 10.1038/s41467-020-19509-y. PMID: 33203887; PMCID: PMC7672059.
[Seroprevalence in Santa Clara County, California.] Bendavid E, Mulaney B, Sood N, Shah S, Bromley-Dulfano R, Lai C, Weissberg Z, Saavedra-Walker R, Tedrow J, Bogan A, Kupiec T, Eichner D, Gupta R, Ioannidis JPA, Bhattacharya J. COVID-19 antibody seroprevalence in Santa Clara County, California. Int J Epidemiol. 2021 May 17;50(2):410-419. doi: 10.1093/ije/dyab010. PMID: 33615345; PMCID: PMC7928865.
[Worldometers data for Arizona.] Available from: https://www.worldometers.info/coronavirus/country/us/
[OurWorldInData.org data for excess mortality by age.] Available from: https://ourworldindata.org/excess-mortality-covid
[OurWorldInData.org data for excess mortality in Sweden.] Available from: https://ourworldindata.org/grapher/excess-mortality-raw-death-count-single-series?country=~SWE