

Excess Death before and after Jabs (corrected)
Excess Death before and after Jabs (corrected)
Sample size = 6.8 billion people

Here is the correct info on the average daily excess death per million (DEDpM) in the 50 largest nations on planet Earth, covering 6.8 billion people. Let’s first look at average daily excess before the COVID jabs rolled out:
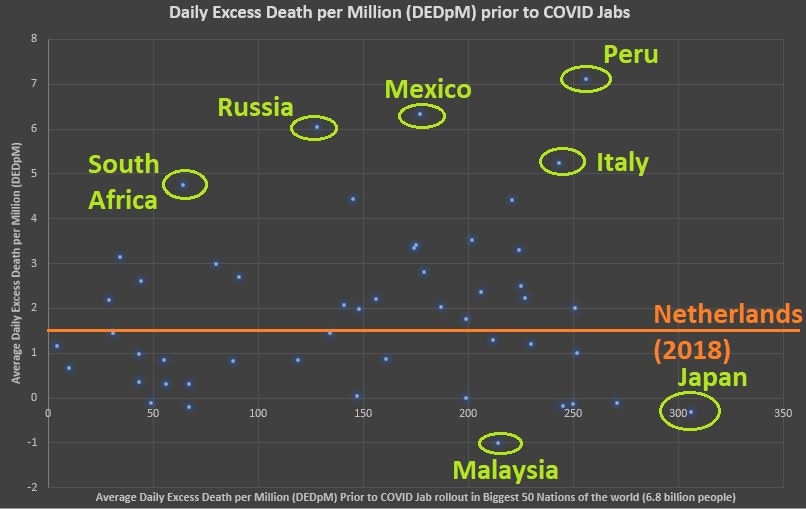
For perspective, the worst recent flu experience — that of The Netherlands in 2018 — was added as an orange line, showing that the flu was so severe that season that, even when averaged, daily excess death for the year was 1.5 per million.
Before COVID jabs rolled out, half of the largest nations on planet Earth (~3.4 billion people) had excess death that was less than the flu of 2018 in The Netherlands, but the other half had excess death that was worse than that severe flu.
Let’s look at the average daily excess death after jabs rolled out though:
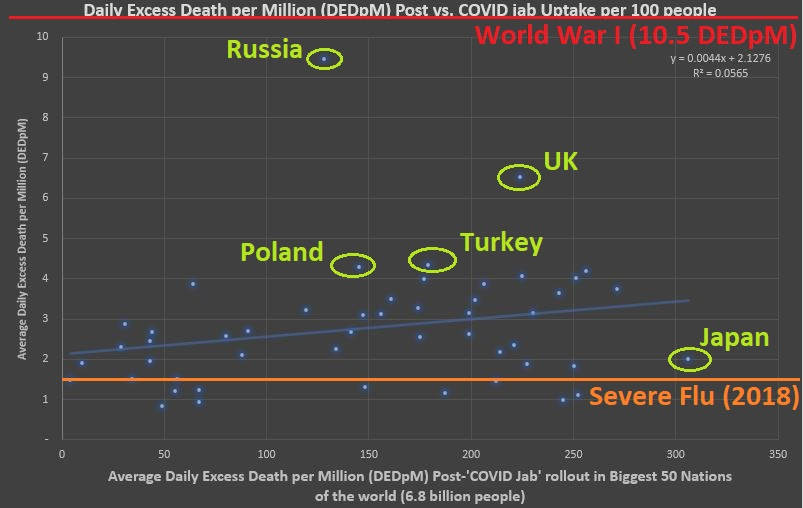
Two perspectives are added to this graph, the severe flu of 2018 in The Netherlands (1.5 DEDpM), and the average daily excess death for the USA in the worst of the two world wars: WWI (10.5 DEDpM). WWII had more total death, but much longer active engagement, making WWI more “deadly.”
Notice what happened in Japan, which had the highest COVID jab rate at over 300 doses for every 100 people there. They went from negative excess death up to an average death rate that is worse than the worst recent flu epidemic.
The UK saw such an increase in excess death after COVID jabs rolled out that it became over half as deadly as a world war. Russia is an outlier and has been in actual war and that makes interpretations problematic.
The trendline shows that, the more and more that COVID jabs were given, the higher and higher the expected excess death became — though with the outliers like Russia included in the data, it wasn’t statistically significant.
Let’s just graph the change (post-jab death rate - pre-jab death rate) in excess death once:
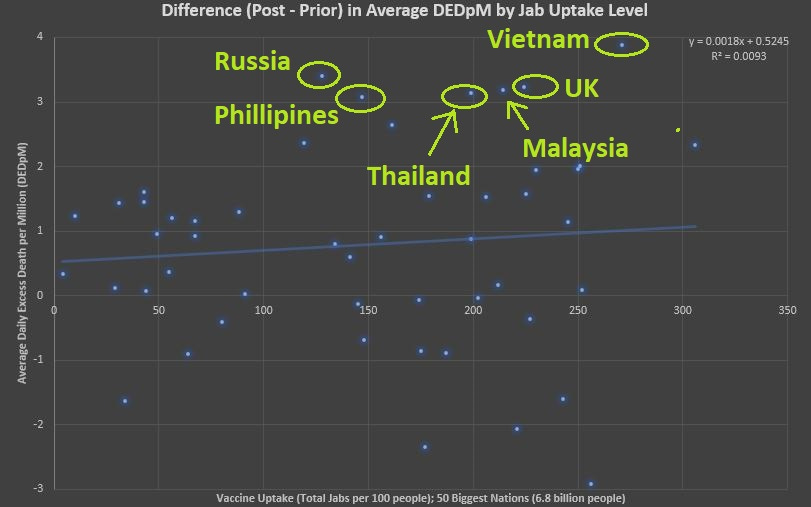
Look at what happened in the UK and in East Asia, the increase alone was worth more than two severe flu epidemics. Again, the trend leans positive (also failing to reach significance) where, if you gave greater and greater amounts of COVID jabs, then the excess deaths trended higher and higher.
People in Vietnam — one of the highest-jabbed nations — felt the effects of COVID jab rollouts the worst. They were decimated there.
Reference
[2020 populations] — Worldometers. https://www.worldometers.info/world-population/population-by-country/
[Estimated Daily Excess Death per 100,000 during COVID] — The Economist data. OWID. https://ourworldindata.org/excess-mortality-covid
[COVID jab levels] — CNN Global Vaccine Tracker. https://www.cnn.com/interactive/2021/health/global-covid-vaccinations/
[average daily excess death during 2018 in the Netherlands was 1.5 per million; peak daily death was 9.9 per million] — van Asten L, Harmsen CN, Stoeldraijer L, Klinkenberg D, Teirlinck AC, de Lange MMA, Meijer A, van de Kassteele J, van Gageldonk-Lafeber AB, van den Hof S, van der Hoek W. Excess Deaths during Influenza and Coronavirus Disease and Infection-Fatality Rate for Severe Acute Respiratory Syndrome Coronavirus 2, the Netherlands. Emerg Infect Dis. 2021 Feb;27(2):411-420. doi: 10.3201/eid2702.202999. Epub 2021 Jan 4. PMID: 33395381; PMCID: PMC7853586. https://www.ncbi.nlm.nih.gov/pmc/articles/PMC7853586/