

Expected COVID Hospitalization Rate
Expected COVID Hospitalization Rate
Post #818

By combining the placebo groups of the two phase 3 mRNA trials, you can get an indication of what the expected COVID hospitalization rate would be moving forward. It’s a rough expectation though, due to an under-representation of elderly and frail among the trial participants. Here is how it compares to observed rates:

NOTE: While the central estimate above is 29 weekly hospitalizations per million, the 99% upper bound (not shown) is 61 weekly hospitalizations per million.
With an average of 29 weekly hospitalizations per million persons expected, you can see that every weekly rate observed was higher than expectations, but that hospitalization rates rose above expectations by over 10-fold when COVID shots were being administered to people — and didn’t return until COVID shot uptake dropped.
Moderna data to 7 Nov 2020 give a rate of severe COVID of 4.072 per 1,000 person-years:
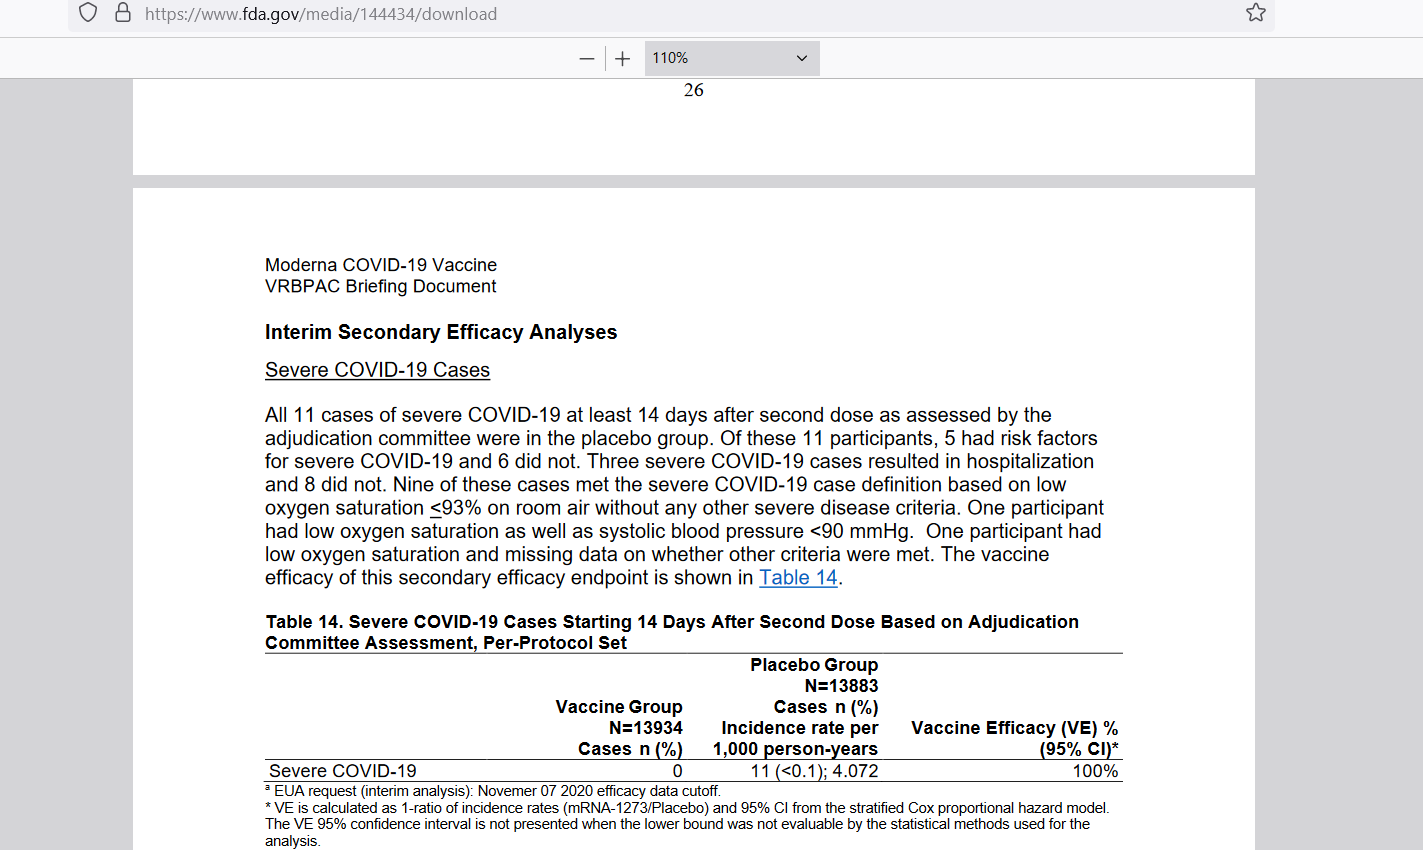
But of the 11 cases in the placebo group, only 3 went to hospital. So the expected (background) hospitalization rate is lower than the rate for severe COVID. The imputed total placebo-group person-years at risk for Moderna will be shown in the notes below.
Pfizer data to 14 Nov 2020 show 9 severe COVID cases in 4,006 person-years:

And 7 out of those 9 severe COVID cases in the placebo group went to hospital. Here are notes showing a simple aggregation of overall numbers to show a combined estimate:

In cell G25 at bottom right, you can see that the expected rate of COVID hospitalization was 29 per million person-weeks (29 hosp/MPW) — or 29 weekly hospitalizations per million. The 99% upper bound of that estimate was 61 weekly hospitalizations per million, and most weeks at top were even above that upper limit.
The upshot of that is that people didn’t even have a 0.2% chance of being hospitalized for COVID over the course of a year. If 1,000 persons were followed for a year, then 998 of them would be make it through the year without being hospitalized for COVID.
This indicates that COVID wasn’t a highly-virulent disease — i.e., one with a large expected disease burden — to begin with. The flu of 2017/18 hospitalized more people than would be expected from COVID placebo group data:

While the 2019 estimate above — of 960,000 flu hospitalizations during the 2017/18 flu season — has since been lowered, it’s still higher than the 389,000 total yearly COVID hospitalizations predicted from the placebo group data of phase 3 trials.
Evidence suggests that COVID shots led to COVID hospitalization rates that were over 10 times higher than the average expected weekly rate — using the rate of hospitalization found in the combined placebo groups of the phase 3 trials. The peak at far-right in the top graph is over 13 times the average weekly expected rate.
Reference
[Weekly hospitalizations per million] — https://ourworldindata.org/grapher/weekly-hospital-admissions-covid-per-million?time=2020-03-01..2022-04-05&country=~USA
[Moderna phase 3 trial data] — https://www.fda.gov/media/144434/download
[Pfizer phase 3 trial data] — https://www.fda.gov/media/144245/download
[CDC’s first estimate of flu hospitalization in 2017/18 was almost a million] — Rolfes MA, Flannery B, Chung JR, O'Halloran A, Garg S, Belongia EA, Gaglani M, Zimmerman RK, Jackson ML, Monto AS, Alden NB, Anderson E, Bennett NM, Billing L, Eckel S, Kirley PD, Lynfield R, Monroe ML, Spencer M, Spina N, Talbot HK, Thomas A, Torres SM, Yousey-Hindes K, Singleton JA, Patel M, Reed C, Fry AM; US Influenza Vaccine Effectiveness (Flu VE) Network, the Influenza Hospitalization Surveillance Network, and the Assessment Branch, Immunization Services Division, Centers for Disease Control and Prevention. Effects of Influenza Vaccination in the United States During the 2017-2018 Influenza Season. Clin Infect Dis. 2019 Nov 13;69(11):1845-1853. doi: 10.1093/cid/ciz075. PMID: 30715278; PMCID: PMC7188082. https://www.ncbi.nlm.nih.gov/pmc/articles/PMC7188082/