While real wealth mostly involves physical objects, such as houses and cars, financial wealth involves pieces of paper with numbers written on them and which stand for this statement:
“I Owe You. And I Promise that, when the Bill comes Due, I Will Pay You the Amount that We Agreed Upon.”
But financial assets can get divorced from the underlying economic reality on the ground, leading to situations where the “pieces of paper” are mistakenly believed to have been more valuable than they really are. Such a thing hit the stock market in 1929. Buying a stock share requires paying a price, and a PE ratio tells if it is worth it.
A PE ratio is a ratio of the stock share price to the earnings of the company. If you buy a stock with a PE ratio of 16, and if the company pays out all earnings in dividends, then each year you will receive 1/16th of that price that you had paid. After 16 years of holding the stock, the accumulated dividends would entirely pay for the stock price.
And you retain the option to sell the stock at its market price. In this case, the sale would be 100% profit (because 16 years of dividends entirely covered the original price paid). It can even make sense to buy the stock and sell it in 8 years, after you’ve only received half of the original price back — because it may sell high enough for profits.
But everything has limits. For instance, if the PE ratio was too high, so high that it’d take over 100 years to get your money back, it could prove too risky an investment — people cannot expect to be “made whole” 100 years after they purchase something. People don’t normally live that long. Here is analysis of the Dow PE ratio in 1929:
In this analysis, it was predicted that — with the median PE ratio of 20.4 for the firms making up the Dow Jones Industrial Average — that you wouldn’t “make money” unless you could expect 8.9% yearly growth for 10 full years. If growth was less than 8.9%, then you would “lose money” — yet many people lined up to buy at that ratio.
Why?
One reason could be that they expected 8.9% yearly growth for at least 10 years, and the 1920s growth would have given them a good reason to believe that. But there are other reasons involving financial fraud and skullduggery which explain the 1929 crash. Those reasons revolve around banks and public utility holding companies.
But that story is for another day.
Today’s story is about how fake our current financials are. Let’s apply that 1929 standard to today’s stock market, replacing the Dow Jones with the S&P 500:
Notice how only 6-to-7 times in recorded history was the PE ratio of 20.4 ever exceeded. Before the dot-com bubble of 2000, the highest peak was 1929. But the more disturbing aspect is found in all years after 2011: persistent elevation in the PE ratio.
Why?
One reason that the current PE ratio is so high might be that people believe in 8.9% yearly growth for the next 10 years. Actually, that only gets you to the orange line. Rats! Well, hmmm. This must mean that people believe in more than 8.9% yearly growth, right?
No, people do not believe that. The recent 5-year nominal growth in S&P 500 was only 8.4%, and a longer time frame would show an even lower average annual growth rate:
That doesn’t even get us up to the orange line, let alone beyond it. The real reason for the over-valued stock market has to do with legalized “money laundering.” When the Fed prints money, it goes into the pockets of those close to the money. When deciding what to do with all the “new money” — financial fat-cats choose the least-worst option:
They throw it into the stock market.
Is it because they expect more than 8.9% yearly growth for at least 10 years? No. The reason it is there is because every other place for it would have yielded less returns. In other words, the stock price no longer reflects investor optimism — like it did in the past — it now reflects a “money sink” into which “new money” is legally laundered.
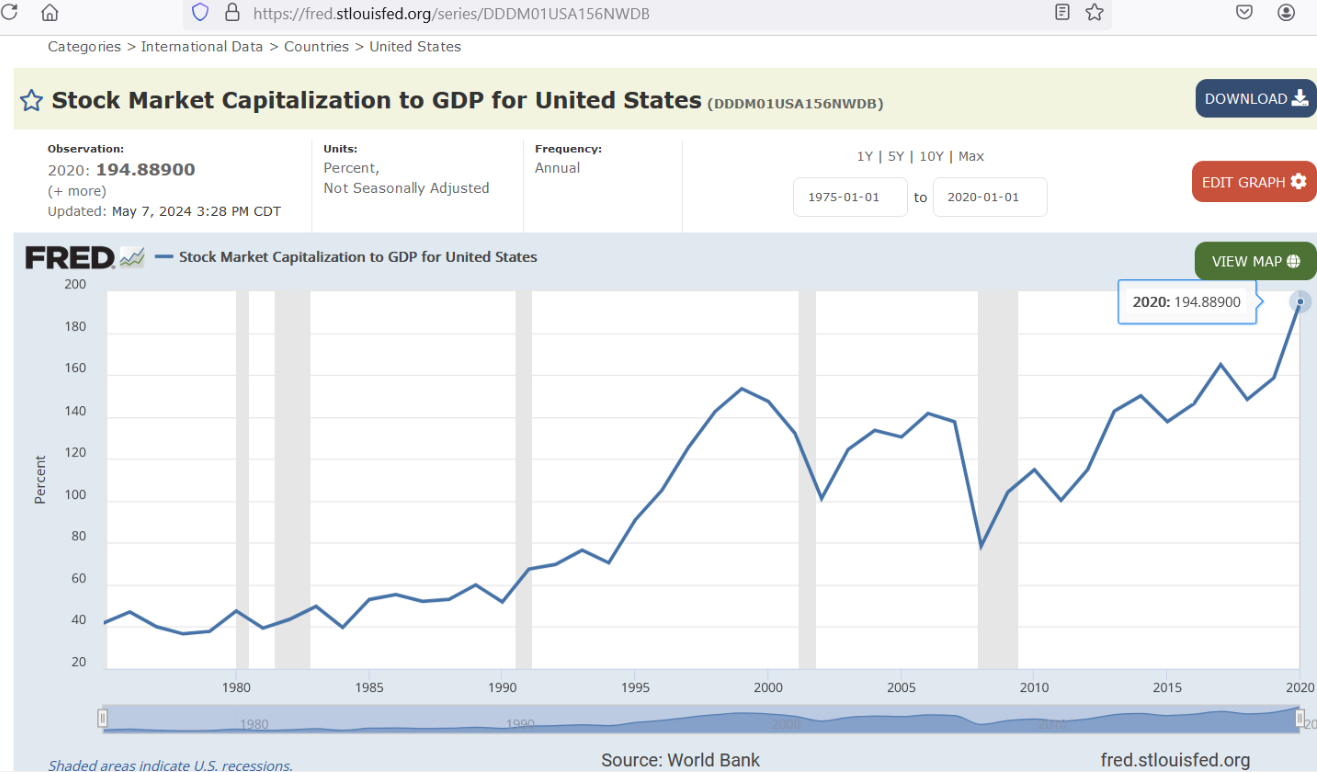
In other words, the “over-valuation” of the stock market isn’t due to someone’s poor foresight, it is a structural break-down of a system drowning in printed cash. It is a byproduct or an artifact of a broken system held on life-support by a stream of cash. Another measure showing how broken U.S. financials are is the Buffett Indicator:
Warren Buffett says this indicator tells the story on whether a market is overvalued. This series ends in 2020 but the other evidence above indicates that, if extended, it would reach even higher than the stock market being valued at 194% of GDP. The evidence suggests that we have got to get back to sound money to save the USA.
Reference
[1929 stock valuation] — https://fraser.stlouisfed.org/files/docs/meltzer/sirsto75.pdf
[PE ratio of S&P 500] — https://www.multpl.com/shiller-pe
[earnings per share growth of S&P 500] — https://ycharts.com/indicators/sp_500_eps
[“Buffet Indicator” of over-valued markets] — World Bank, Stock Market Capitalization to GDP for United States [DDDM01USA156NWDB], retrieved from FRED, Federal Reserve Bank of St. Louis; https://fred.stlouisfed.org/series/DDDM01USA156NWDB


