

February of 2021 for 80-84 year-olds in the UK
February of 2021 for 80-84 year-olds in the UK
Incredibly high death

Error: This Substack contains an error in that the baseline rate shown was for those 80-84 but the observed death rates shown were for those 80-89. The points made don’t materially change, but instead of over 8 times the expected death in February of 2021, never-jabbed experienced over 6 times.
To get the expected death rate of 80 to 84 year-olds by month in the UK, an average yearly rate of 5854 per 100,000 (from 2016) could be modified by a seasonality index. Here is what it looks like:
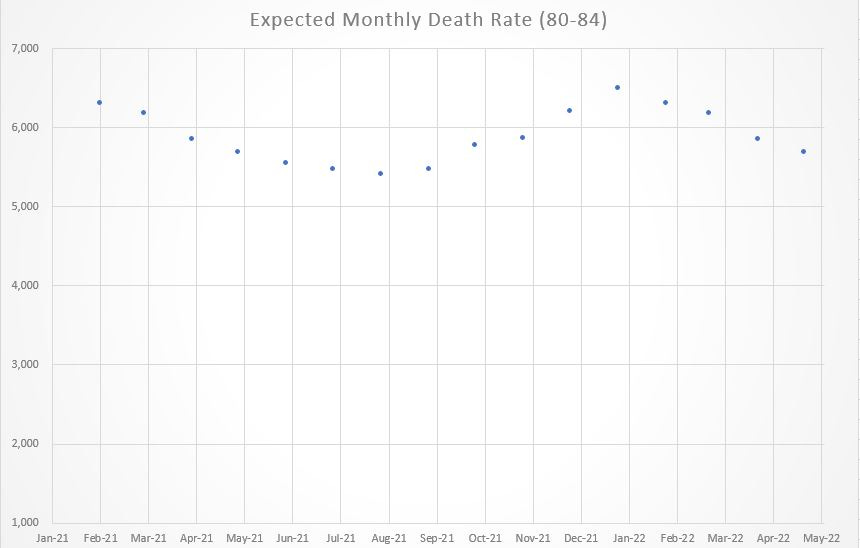
[click image to enlarge]
Each blue dot is actually a new month, beginning at left with January of 2021 and ending at right with May of 2022. Now let’s superimposed the recorded death rate among those ever-jabbed in the UK:

[click image to enlarge]
January of 2021 (orange dot at far left) had a recorded death rate that was lower than what would be expected if the 2016 rates, along with the seasonal adjustment, could be relied upon.
Late 2021 (center-right), even among those who took a jab, had high death rates.
Now let’s add in those never-jabbed:
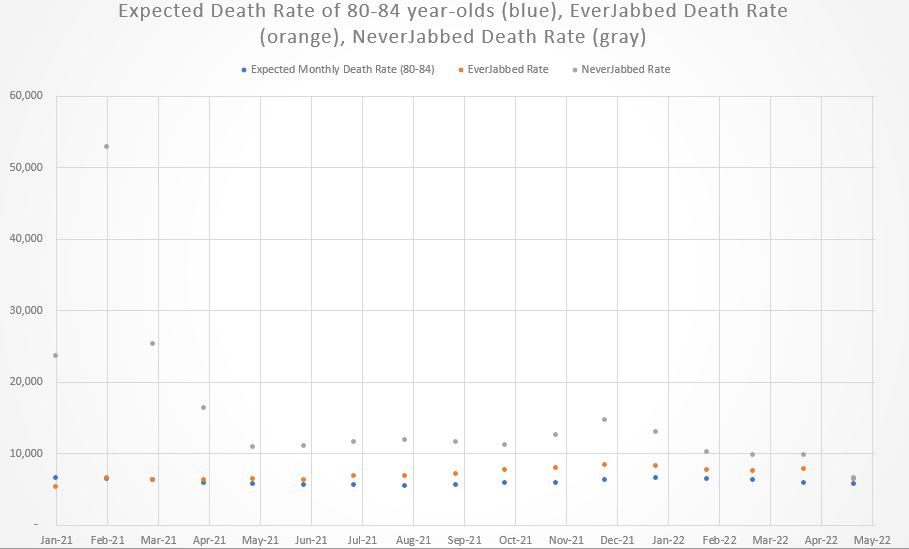
[click image to enlarge]
Notice how the scale changed in order to accomodate the incredibly high death rate in February of 2021 — a death rate over 8 times higher than expected. Further research will reveal whether that spike in death coincides with a very high rate of COVID jab administration among 80 to 84 year-olds in the UK.
My guess is that the incredible death spike among those never-jabbed actually WILL coincide with high jab rates in this age group, so that misclassification of deaths among those who had taken a jab (calling them an “unjabbed death”) will explain how it is that you can get into a position where people are dying at over 8 times the expected rate.
COVID itself — on its worst day — was never more than twice as severe as severe flu, so you cannot rely on COVID to explain a death rate that is over 8 times higher than expected.
Also of note is the complete lack of difference in death rates in May 2022.
Error: This Substack contains an error in that the baseline rate shown was for those 80-84 but the observed death rates shown were for those 80-89. The points made don’t materially change, but instead of over 8 times the expected death in February of 2021, never-jabbed experienced over 6 times.
Reference
[age-specific UK death rates] — Health Profile for England. Chapter 2: trends in mortality. Published 11 September 2018. https://www.gov.uk/government/publications/health-profile-for-england-2018/chapter-2-trends-in-mortality
[adjusting average yearly death by a seasonal index, to get month-specific death rates] — Falagas ME, Karageorgopoulos DE, Moraitis LI, Vouloumanou EK, Roussos N, Peppas G, Rafailidis PI. Seasonality of mortality: the September phenomenon in Mediterranean countries. CMAJ. 2009 Oct 13;181(8):484-6. doi: 10.1503/cmaj.090694. Epub 2009 Sep 21. PMID: 19770237; PMCID: PMC2761439. https://www.ncbi.nlm.nih.gov/pmc/articles/PMC2761439/
[National death data in the UK] — Office for National Statistics. Table 2. https://www.ons.gov.uk/peoplepopulationandcommunity/birthsdeathsandmarriages/deaths/datasets/deathsbyvaccinationstatusengland