

RFK Jr. and Children’s Health Defense have been trying to get fluoride out of drinking water for years, but the government keeps slow-rolling. In this Defender report, it was brought out that the government even tried to block the release of truthful information about it.
A forest plot is a graph that let’s you know the direction and magnitude of the effect of something, as well as the precision in the estimation of it (the uncertainty). The following plot shows the reduction in child IQ from fluoride exposure is about a “half-standard deviation” in reduction — but a couple studies found much larger effects:
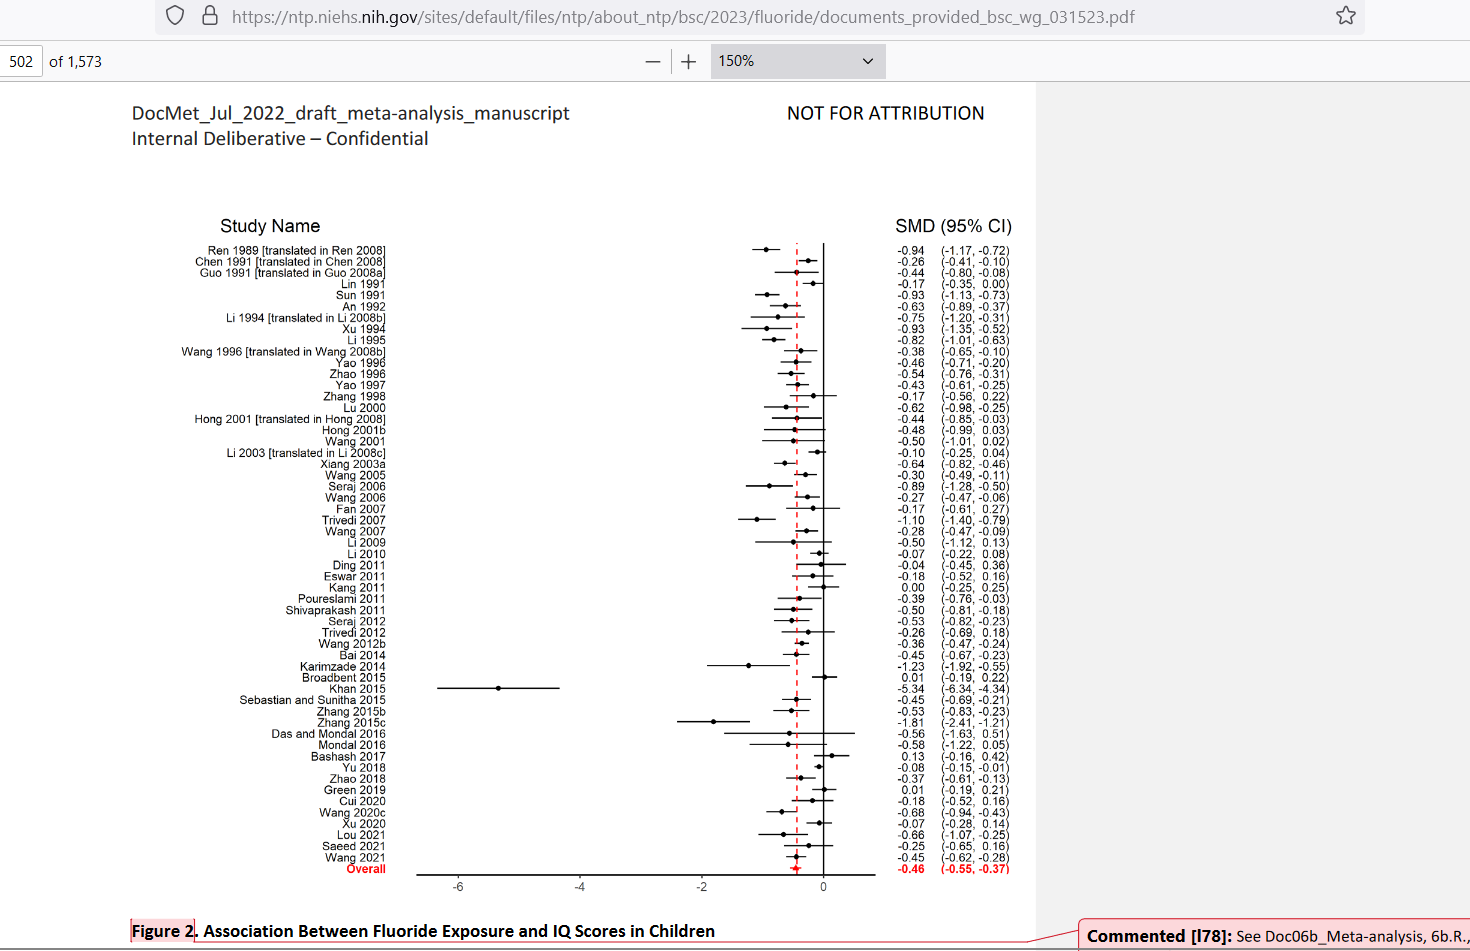
One study near the bottom found a decrease in IQ worth more than 5 standard deviations. While another study found a decrease of almost 2 standard deviations. Many studies found a “one-standard deviation” decrease in IQ.
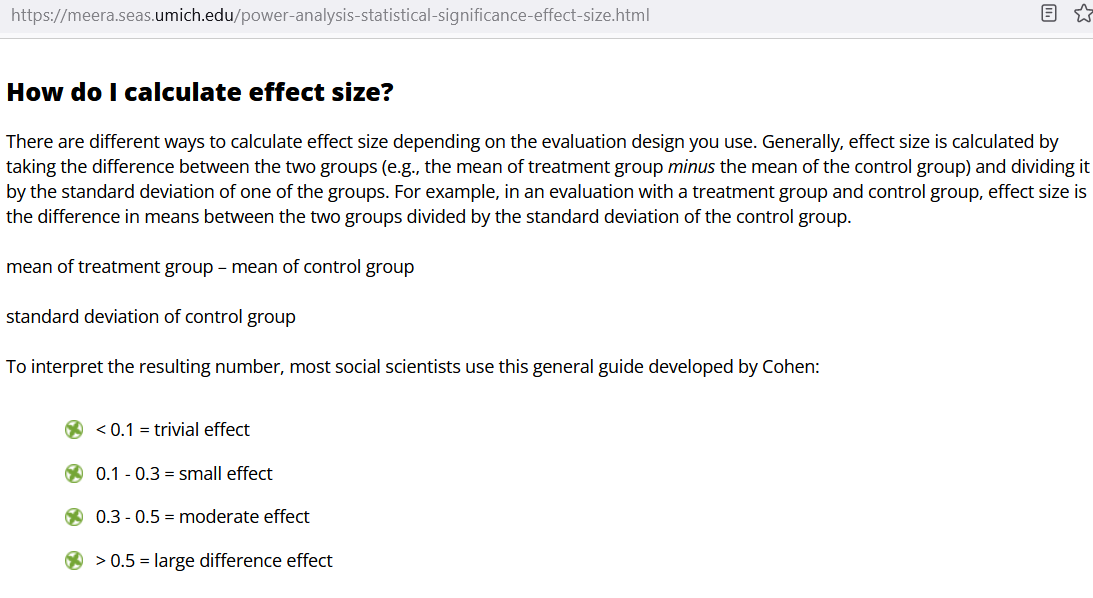
To put that into perspective, social scientists generally consider that, when a standardized mean difference — a common measure of the “effect size” — reaches 0.5, then you’ve got a big effect which should guide public policy, rather than remain ignored by government officials:
Many life consequences result from having an IQ lower than your potential, and it’d be difficult to fully measure all of the harm from all of the kids who will never make it to their potential due to fluoride exposure when young.
Reference
[report that was originally blocked by government officials] — DRAFT. NTP Monograph on the State of the Science Concerning Fluoride Exposure and Neurodevelopmental and Cognitive Health Effects: A Systematic Review. https://ntp.niehs.nih.gov/sites/default/files/ntp/about_ntp/bsc/2023/fluoride/documents_provided_bsc_wg_031523.pdf