Four Matching Patterns
Post #989
[click image to enlarge]
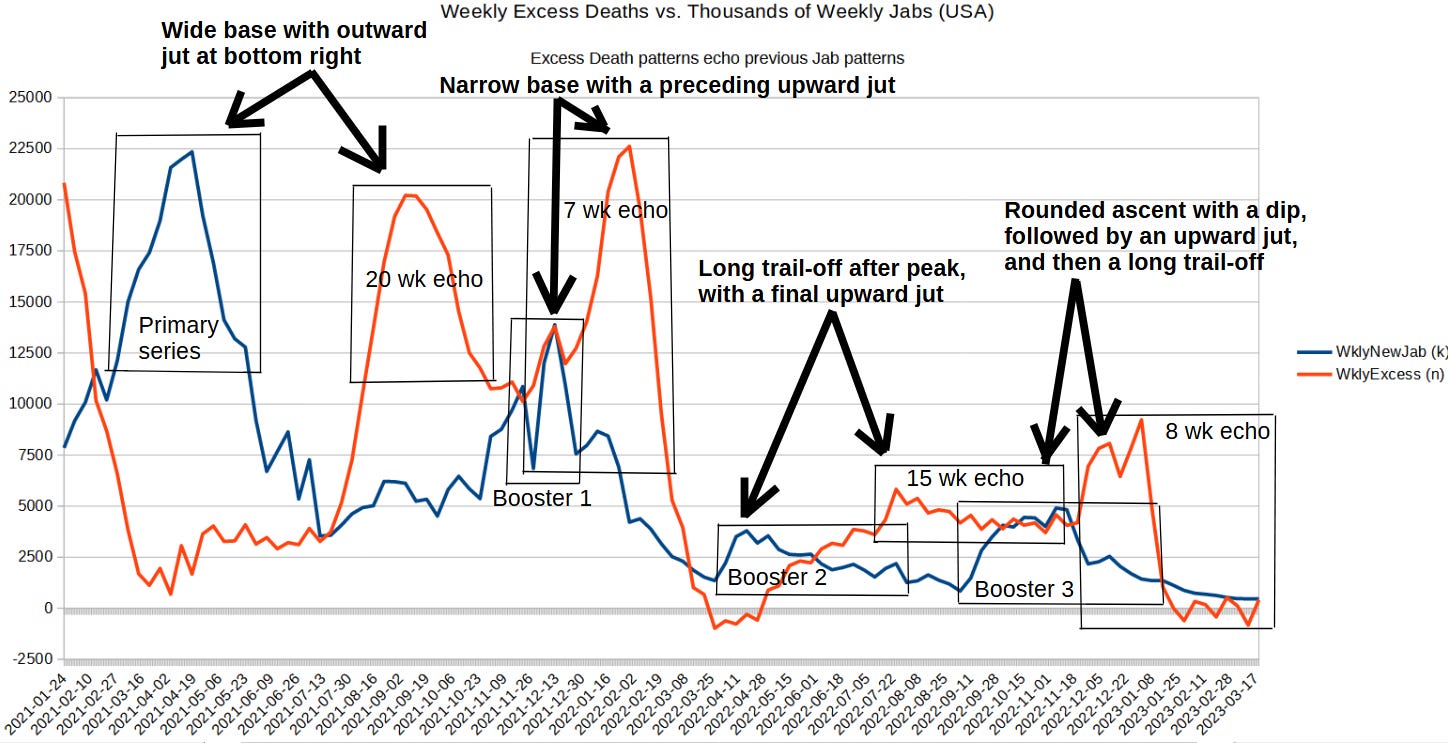
The pattern of primary series doses was echoed by the pattern of excess deaths after moving forward in time by 20 weeks — just as if taking primary series doses made you more likely to die 20 weeks after the dose. For the first booster, the jab pattern was replicated with an excess death pattern much sooner — just 7 weeks after the shot.
In a simple statistical test, a model with only 4 possible patterns for excess deaths to take — each one being a near-perfect match to one of the 4 patterns of COVID shot uptake — you would have (4*4*4*4 =) 256 possible arrangements. The correct excess deaths arrangement is this:
primary series pattern first
booster #1 pattern second
booster #2 pattern third
booster #3 pattern fourth
But there are 255 “wrong” arrangements also — where the pattern of excess death after the shots doesn’t perfectly match up with the pattern of the shots, themselves, like they did in the real world.
The chance to “accidentally” get the particular excess deaths arrangement that exactly matches the pattern of shots preceding it — the right pattern in each of the 4 spots — is already statistically significant:
Less than a 1% chance for a full match in the patterns (a 1-out-of-256 chance).
And that is in a model assuming that there were only 4 ways that excess deaths could ever show up. In reality, there were millions of ways that those excess deaths might have patterned themselves, making it almost impossible to obtain 4 consecutive matching patterns of shots/deaths, unless it is true that the shots lead to excess deaths.
Reference
[Excess mortality using raw death counts] — https://ourworldindata.org/excess-mortality-covid
[COVID-10 vaccine doses administered by manufacturer] — https://ourworldindata.org/covid-vaccinations


