

From 2019, Weekly Deaths in Canada Worse Each Year
From 2019, Weekly Deaths in Canada Worse Each Year
2020 increase not significant, 2021 significant, 2022 highly significant

The crude weekly death count could be expected to rise by a tiny bit (~ 1%) each year in a nation whose population is getting older by the year. Even so, when looking at the 40 pandemic weeks of 2020 (Week #13 through Week #52), and comparing the count of deaths to the following years, an obvious trend appears:

In each year after 2019, weekly death counts grew larger. The standard score, Z, represents the number of standard deviations you are from a baseline or from a mean (an average).
The raw “change-from-2019-baseline” in the 40-week mean weekly death count — using just the mean and standard deviation of 2019 to form Z scores — became signficant* after COVID jabs rolled out.
And it became even more signficant (even worse weekly death) in the year after the COVID jabs rolled out:
[click to enlarge]
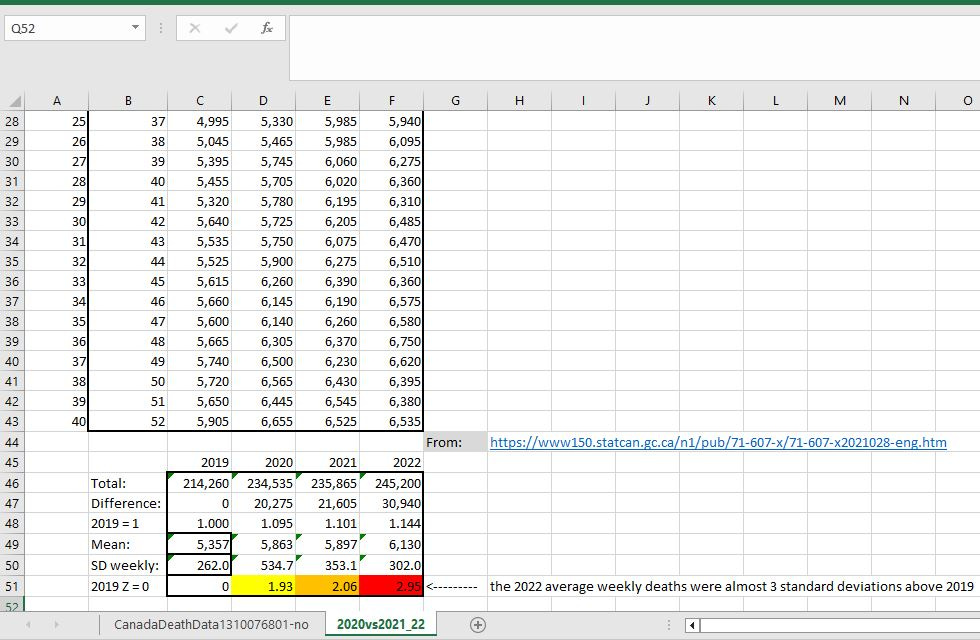
Notice in cell D48 how it is that the 40-week death total from 2020 was 9.5% more than in 2019, but the 2022 death total (cell F48) was 14.4% more than 2020. Evidence suggests that COVID jabs increase the amount of people who die each week.
*Note: using the standard error of the 2019 mean to form the “change-from-2019-baseline” Z scores would have led to Z scores 6 times larger.
Not only Canada.