
Good Economic Indicators
Post #679

Good economic indicators would be good at representing the experience of most people (broad prosperity), rather than just the experience of CEO’s or finance moguls (narrow prosperity). To accompany this prior work on whether regular people are doing better, I’m adding more markers which measure broad prosperity.
In a report from Vigilant News, it was brought out that pundits now claim that Biden policies have (somewhat) fixed the economy, regarding economic outlook and inflation (and also stemming crime/violence). While durable goods purchases per capita is dealt with in the link of the first paragraph above, let’s look deeper …
Net Savings
To get ahead, you have got to save some of your income, so that some or all of your savings can get lent out to upstart businesses, or to existing businesses so that they can expand. No savings = no future. But for the first three quarters of 2023, net savings was negative:
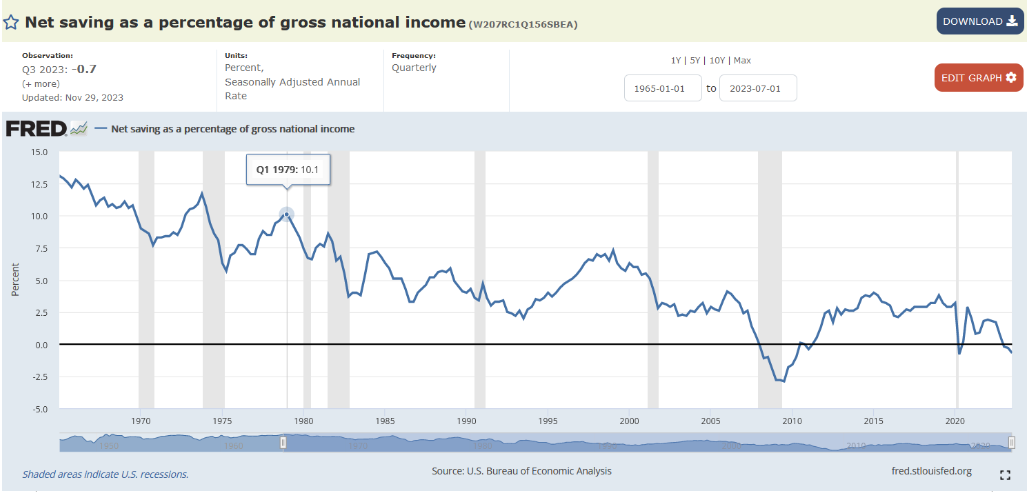
It cannot be said that policies are “doing well” while a nation undergoes negative net savings. There is no future in negative net savings. It means that, for consumption and investment today, you are borrowing against your own future — selling off the rights to your own future income.
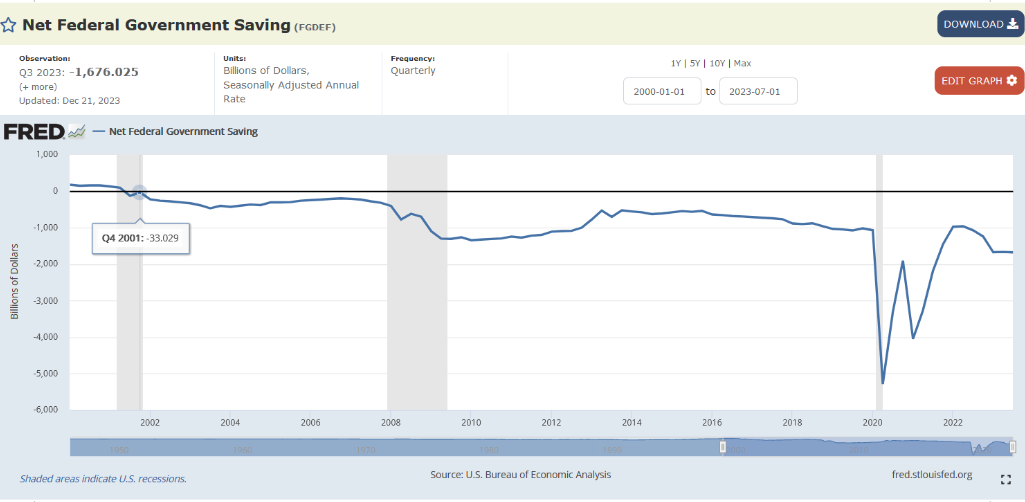
Deficit Spending
If you want to know the biggest source of negative savings, it is federal spending. Back in the fourth quarter of 2001, the annualized federal deficit was $33 billion. But the federal government is now running one-to-two-trillion-dollar deficits, and that is not sustainable:
Monetized Debt
Much of these annual federal spending sprees are bankrolled by printed money. And this increases the actual inflation rate, and even the forecasted or expected inflation rate. At the end of March 2022, it was expected that, just to break even, you needed to obtain 3.3% interest (because 5-year inflation was expected to average out at 3.3%:
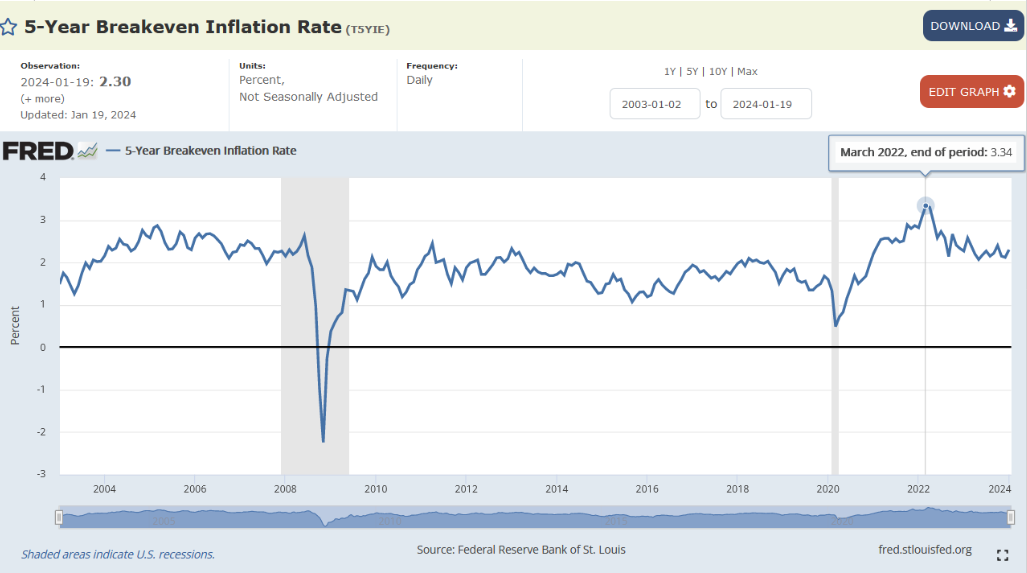
This makes it hard to remain in the same place, let alone to try to get ahead. But the mechanism of money growth which sits behind all inflationary cycles paints a picture even worse than the expected 5-year average inflation above.
Spendable Cash to Private-Sector GDP
Back in the fourth quarter of 2007, there were 11 cents in spendable cash for every dollar of private sector GDP (spendable cash vs. the goods & services that cash buys):
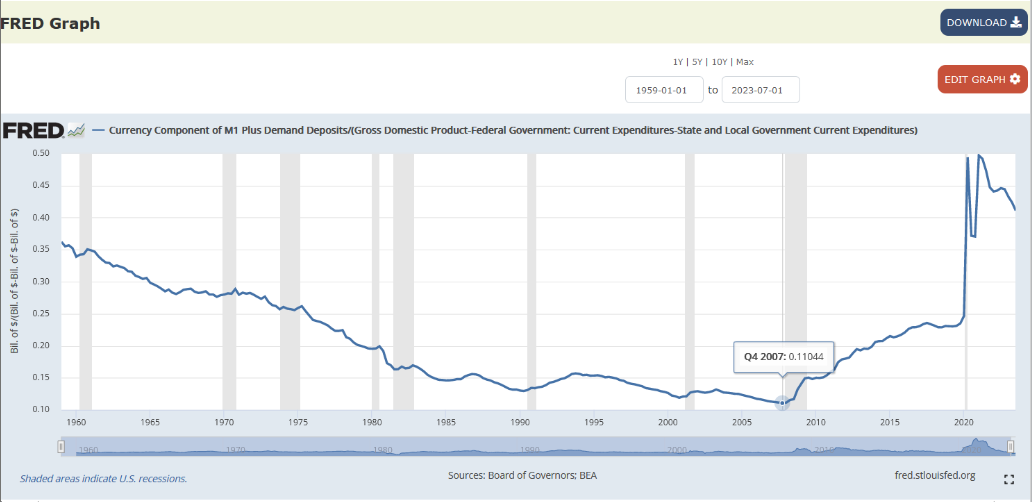
But the COVID debacle led to there being almost 50 cents in spendable cash for every dollar of private sector GDP. Because that higher share is more than quadruple that of 2007, then the expectation is that it has the potential to more than quadruple the 2007 price of things.
While it came down a little recently, it is still so high that the U.S. economy will not be able to escape the misallocation of resources which coincides with inflating the money supply.
The evidence suggests that Biden policies are not fixing anything. The real fix is to return to the economic freedom which the USA had in prior times, such as in the 1920s.