

Government "intervention" cuts Median Purchasing Power
Government "intervention" cuts Median Purchasing Power
Encroachments on Economic Freedom make most of us more poor over time

When nations violate economic laws, such as when governments practice “interventionism” rather than letting the markets sort everything out, poverty increases.
An example would be the “public-private partnership” — a euphemism for fascism — where government cuts a deal with corporations, often at great loss to consumers. When elites call for a Great Reset, they are interested in increasing the government interference into the private business affairs of the people, making matters even worse.
A good metric for measuring the harm caused by government interference into the private business affairs of people — rather than letting all people make voluntary contracts without government-imposed restrictions — is the median purchasing power for basic necessities.
Five basic necessities are: Clothing, Food, Housing, Energy, and Medical Care
Here is how the US median purchasing power of basic necessities has evolved now that the US government intervenes so much more into the US economy:
Clothing
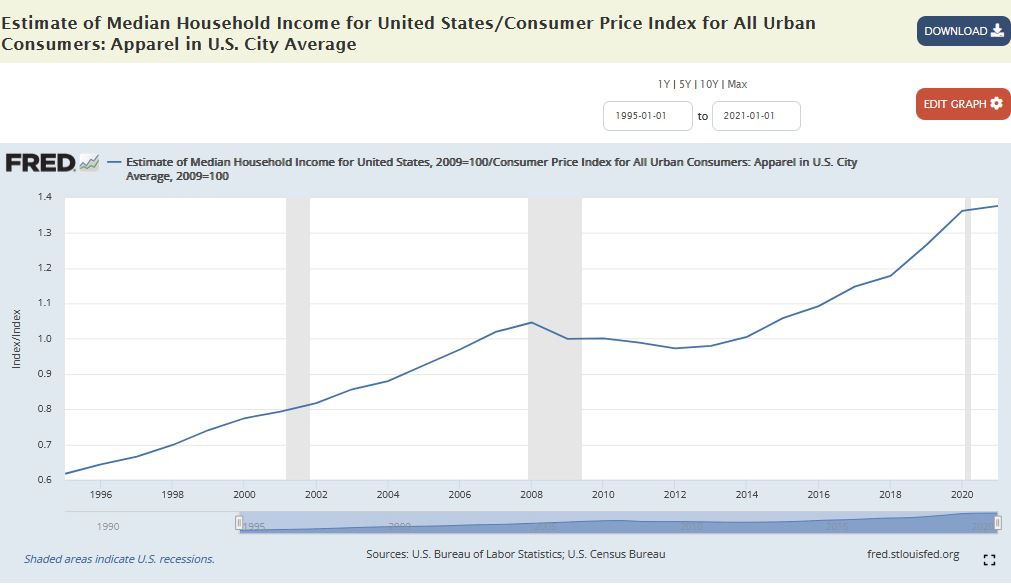
This graph shows the situation improving over time, after a dip in the purchasing power of clothing (apparel) after 2008. The year of 2009 serves as the benchmark, when the ratio of price indices — one for median income, one for clothing prices — was 1.
The final year of 2021 at top right indicates that, if you spent all income on clothes, then you could buy almost 40% more clothing than in 2009. But for many people, clothing is the least of their spending on basic necessities, so let’s look now at the median purchasing power of the other 4 basic necessities:
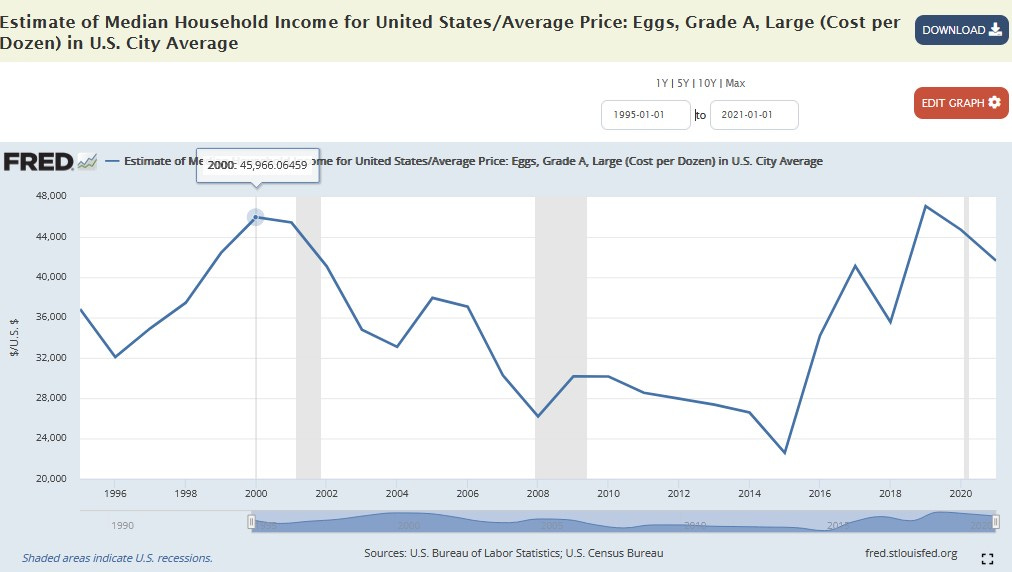
Food
[click to enlarge]
Back in the year 2000, median household income (when applied, 100%, toward the purchase of eggs) could buy 46,000 cartons of eggs. But that’s 10% more eggs than can be purchased on median income today:
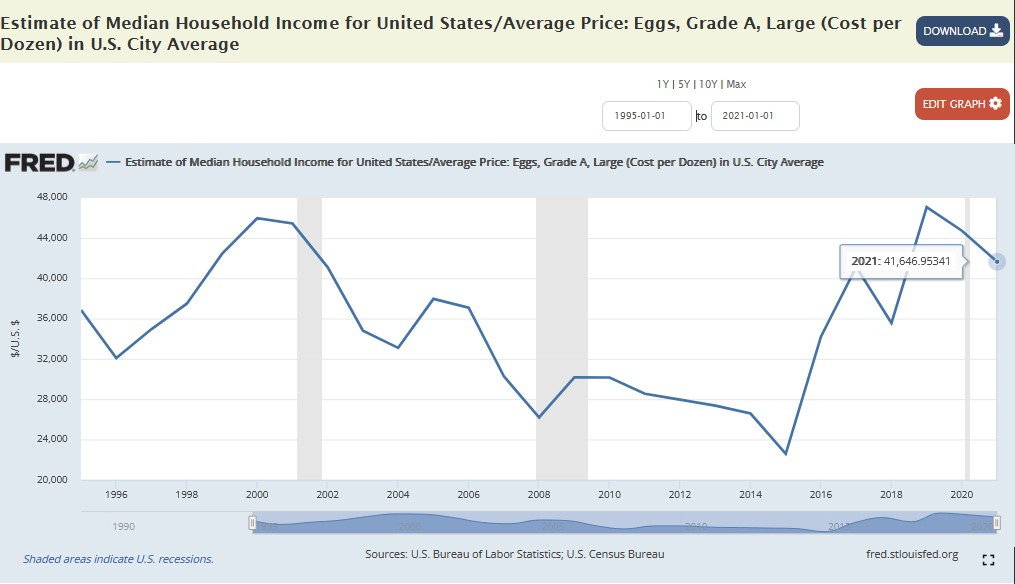
While just one food item isn’t a comprehensive picture, most would agree that food is less affordable now.
Housing
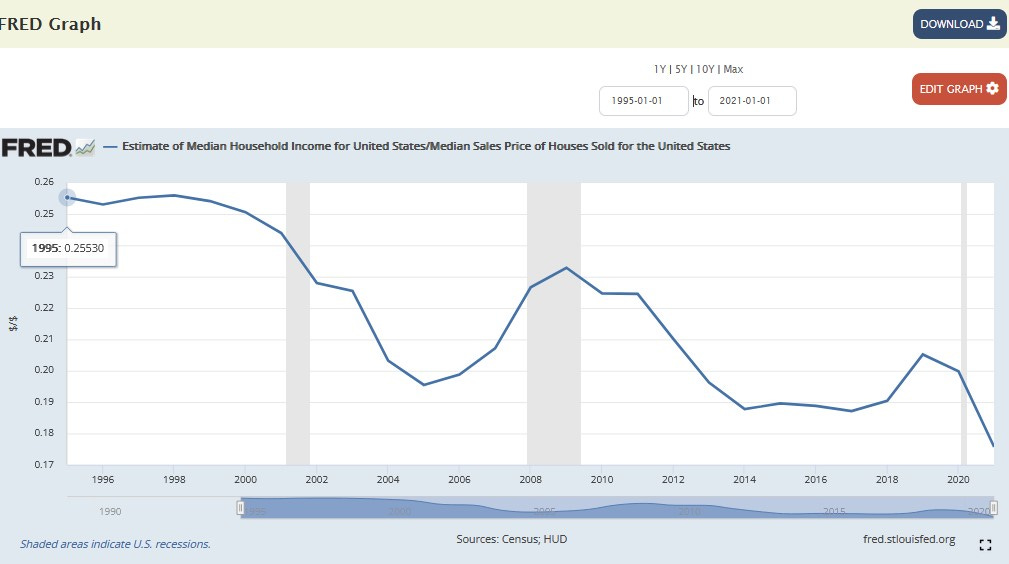
Back in 1995, annual income for the median household bought over 25% of a median-priced house. That means that you could buy a home with 4 years of income. But that’s 45% more home-purchasing-power than in 2021:
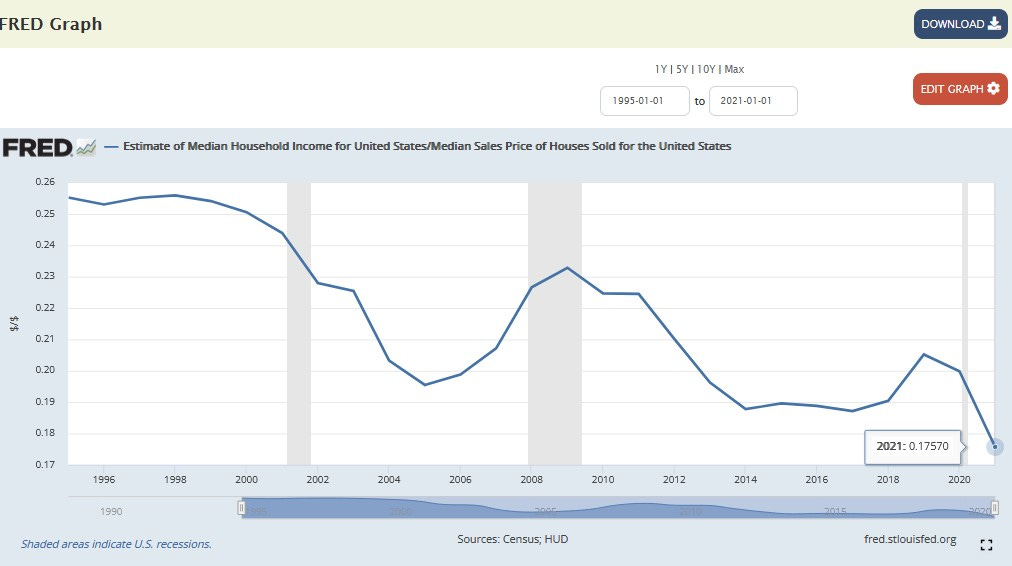
Annual income for median households could only by 17.5% of a home in 2021 — meaning that it takes 5.7 years of income to buy a house today.
Critics may say that homes got larger, but while homes may be a little larger than in 1995, they are nowhere near 45% larger. So the purchasing power, even on a “per-square-feet-of-floor-area” basis has definitely dropped.
Energy — Electricity
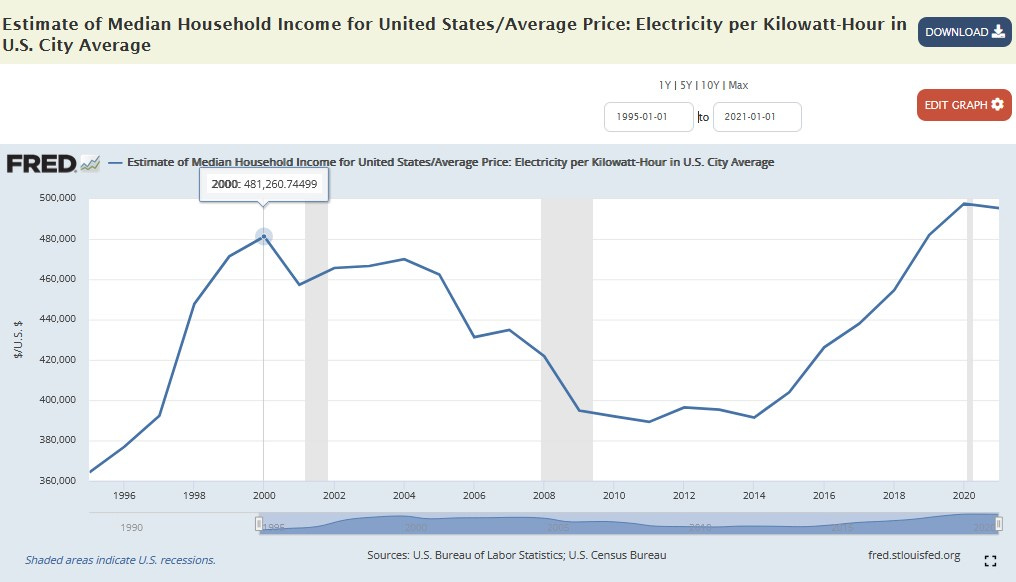
A year of median household income bought you 481,000 kiloWatt-hours of electricity back in the year 2000, and after a decade of decline it has rebounded up to almost 103% of the year 2000 value:
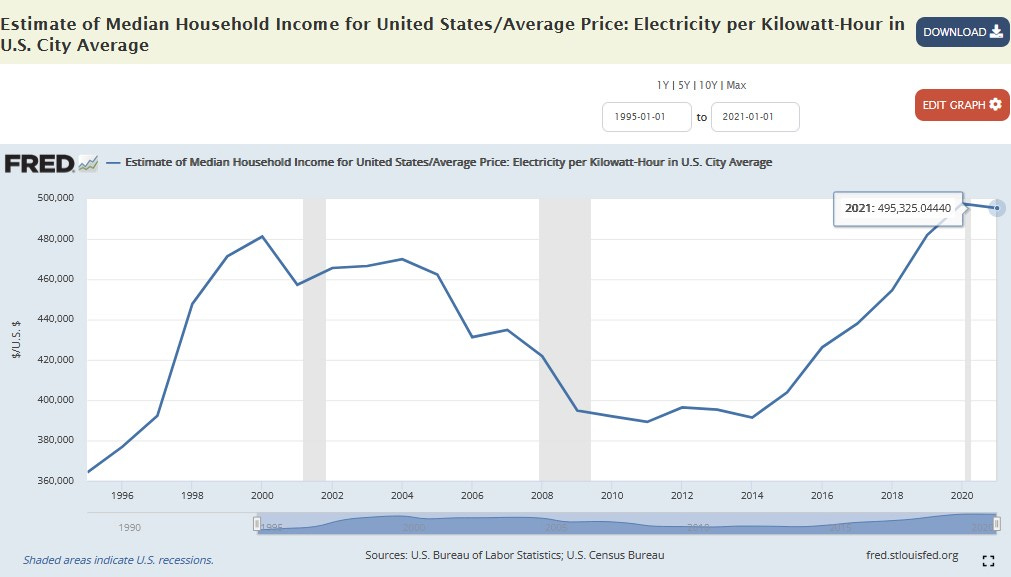
But only being able to afford almost 3% more electricity over a span of 21 years is not a “success,” as that is not even 1% more, for every 7 years. Free markets in energy production would have improved things far beyond what you see here.
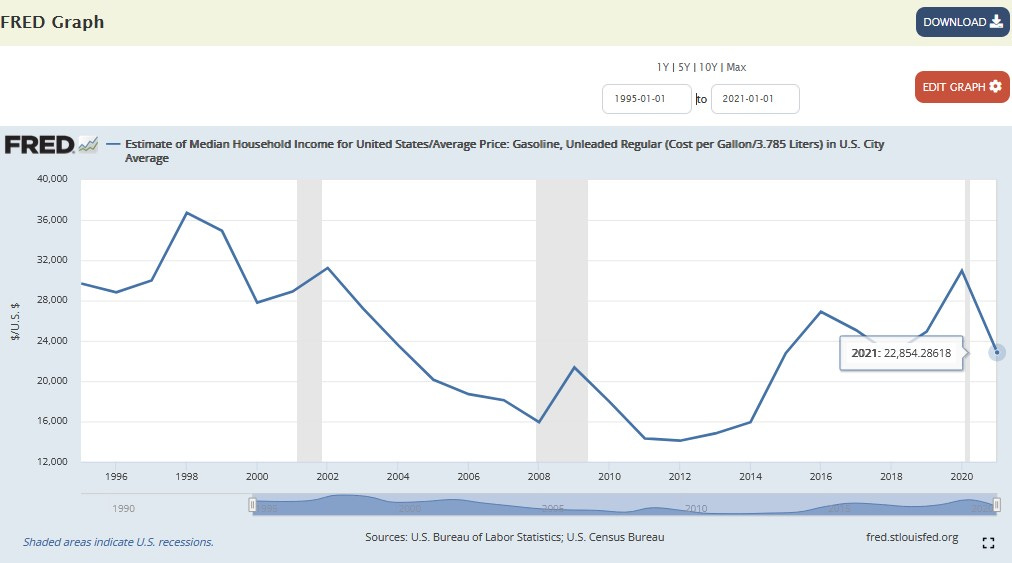
Energy — Gasoline
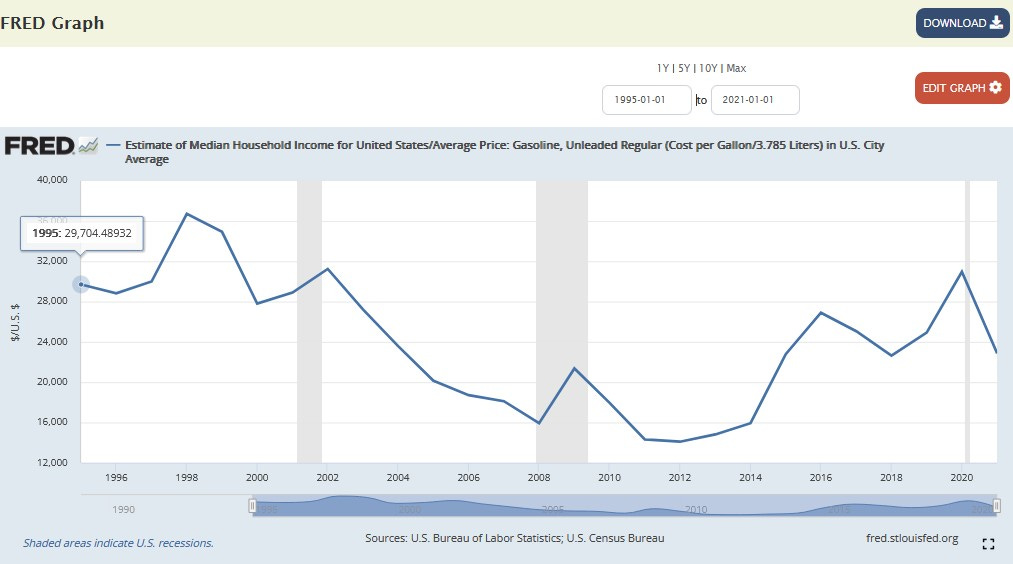
A year of median household income used to be able to buy you 30,000 gallons of gasoline. In 1998, it even bought 37,000 gallons of gasoline. But recently, you can only buy about 23,000 gallons of gasoline with median household income:
Medical Care
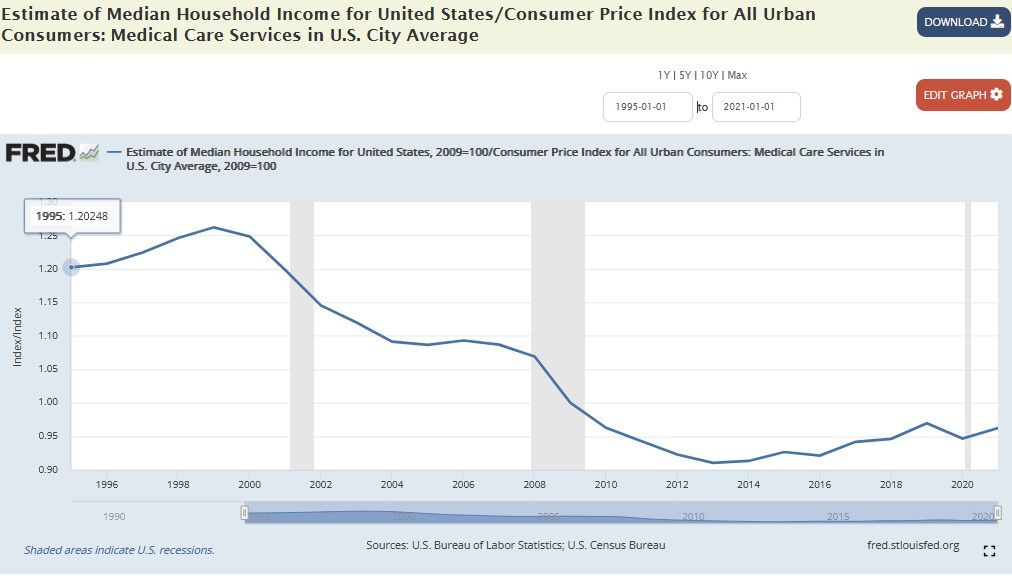
With a benchmark set to what you could buy in 2009, you could buy 20% more medical care back in 1995. But look what happened after the government increased the intervention into healthcare with the “Affordable Care Act” of 2010:

In 2021, you couldn’t even buy as much medical care as you could back in 2009. So much for “affordable” healthcare.
Putting it all Together
Evidence suggests that, overall, middle income US households are becoming more poor over time — with lower purchasing power over basic necessities when they are in aggregate or averaged.
Those who think that it is okay to interfere with economic freedom, like the US government has been increasingly doing — for at least the quarter-century which shows up in these graphs — are those who now call for a Great Reset, because that is the only thing that could hide the effects of what they have done to the affordability of living standards already.
Instead of allowing the economic freedom that would restore American prosperity, they seek to double-down on the policies which have been making the middle class more poor. Globalization efforts need to be thwarted, but the USA still has a long way to fall.
Don’t be complacent that you “only” lost 45% of your home purchasing power, or whatever (that it “only” takes 45% more years of labor for you to buy a home). If the elites behind the Great Reset have their way, you’ll lose 100% of it.
Reference
U.S. Census Bureau, Estimate of Median Household Income for United States [MHIUS00000A052NCEN], retrieved from FRED, Federal Reserve Bank of St. Louis; https://fred.stlouisfed.org/series/MHIUS00000A052NCEN
U.S. Bureau of Labor Statistics, Average Price: Gasoline, Unleaded Regular (Cost per Gallon/3.785 Liters) in U.S. City Average [APU000074714], retrieved from FRED, Federal Reserve Bank of St. Louis; https://fred.stlouisfed.org/series/APU000074714
U.S. Census Bureau and U.S. Department of Housing and Urban Development, Median Sales Price of Houses Sold for the United States [MSPUS], retrieved from FRED, Federal Reserve Bank of St. Louis; https://fred.stlouisfed.org/series/MSPUS
U.S. Bureau of Labor Statistics, Consumer Price Index for All Urban Consumers: Medical Care Services in U.S. City Average [CUUR0000SAM2], retrieved from FRED, Federal Reserve Bank of St. Louis; https://fred.stlouisfed.org/series/CUUR0000SAM2
U.S. Bureau of Labor Statistics, Average Price: Eggs, Grade A, Large (Cost per Dozen) in U.S. City Average [APU0000708111], retrieved from FRED, Federal Reserve Bank of St. Louis; https://fred.stlouisfed.org/series/APU0000708111
U.S. Bureau of Labor Statistics, Average Price: Electricity per Kilowatt-Hour in U.S. City Average [APU000072610], retrieved from FRED, Federal Reserve Bank of St. Louis; https://fred.stlouisfed.org/series/APU000072610
U.S. Bureau of Labor Statistics, Consumer Price Index for All Urban Consumers: Apparel in U.S. City Average [CPIAPPSL], retrieved from FRED, Federal Reserve Bank of St. Louis; https://fred.stlouisfed.org/series/CPIAPPSL