
Government Size and Scope
Post #1679

The size and scope of the federal government is much different now than it was 50 years ago but, because the change happened over decades, and because some things really did improve over time, it is difficult to discover that government overreach is the reason that it has become harder for U.S. citizens to afford a given living standard.
Two adjacent decades with dramatically different government size and scope are the 1960s (small government; capitalist) and the 1970s (big government; interventionist), with the added factor that 1971 was the year we went fully onto fiat currency which can be debased in order to fund government growth:
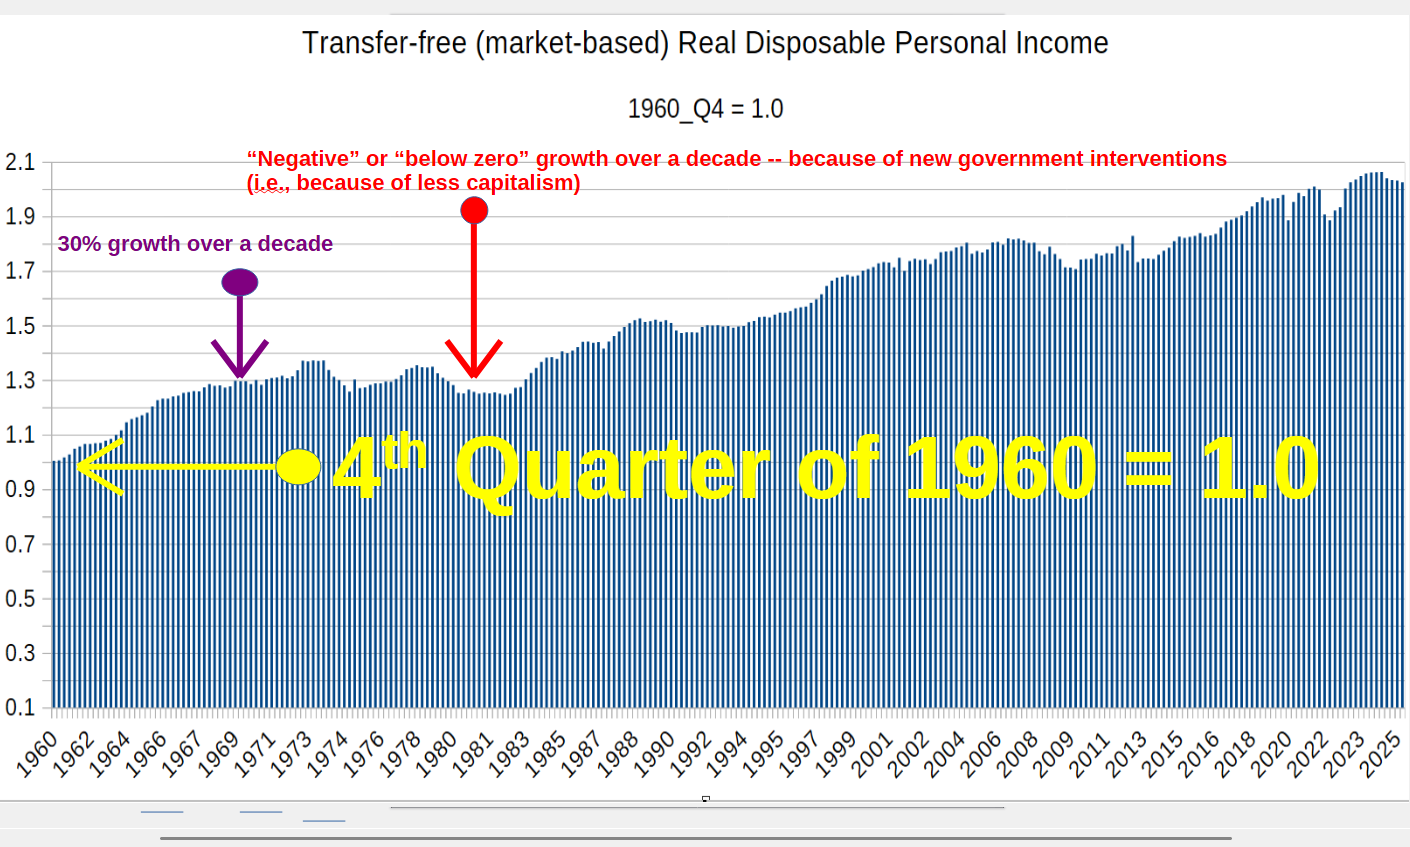
The chart above shows the real market incomes of individuals, indexed to what it was in the 4th Quarter of 1960. During the 1960s, real per capita market income grew 30%. During the 1970s, it did not grow at all (actually shrank). Here is a zoomed-in version of the chart above, allowing you to see when growth stopped:
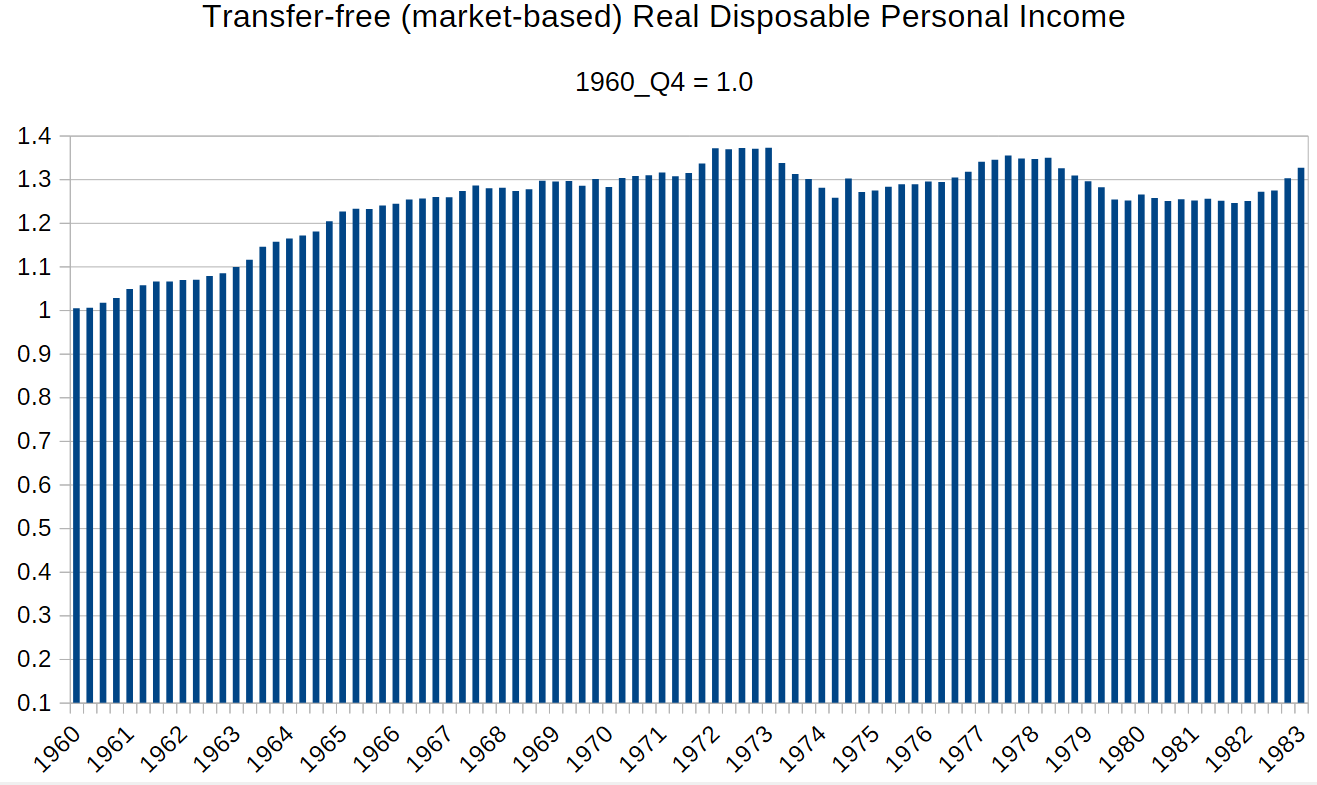
It was not until 1983 — after Reagan’s free-market policies had begun to effect an economic recovery — that the return of progress would be seen. A fair test of administrations of government is the average annual growth of 8 consecutive years, because many of the U.S. presidents govern for that long:
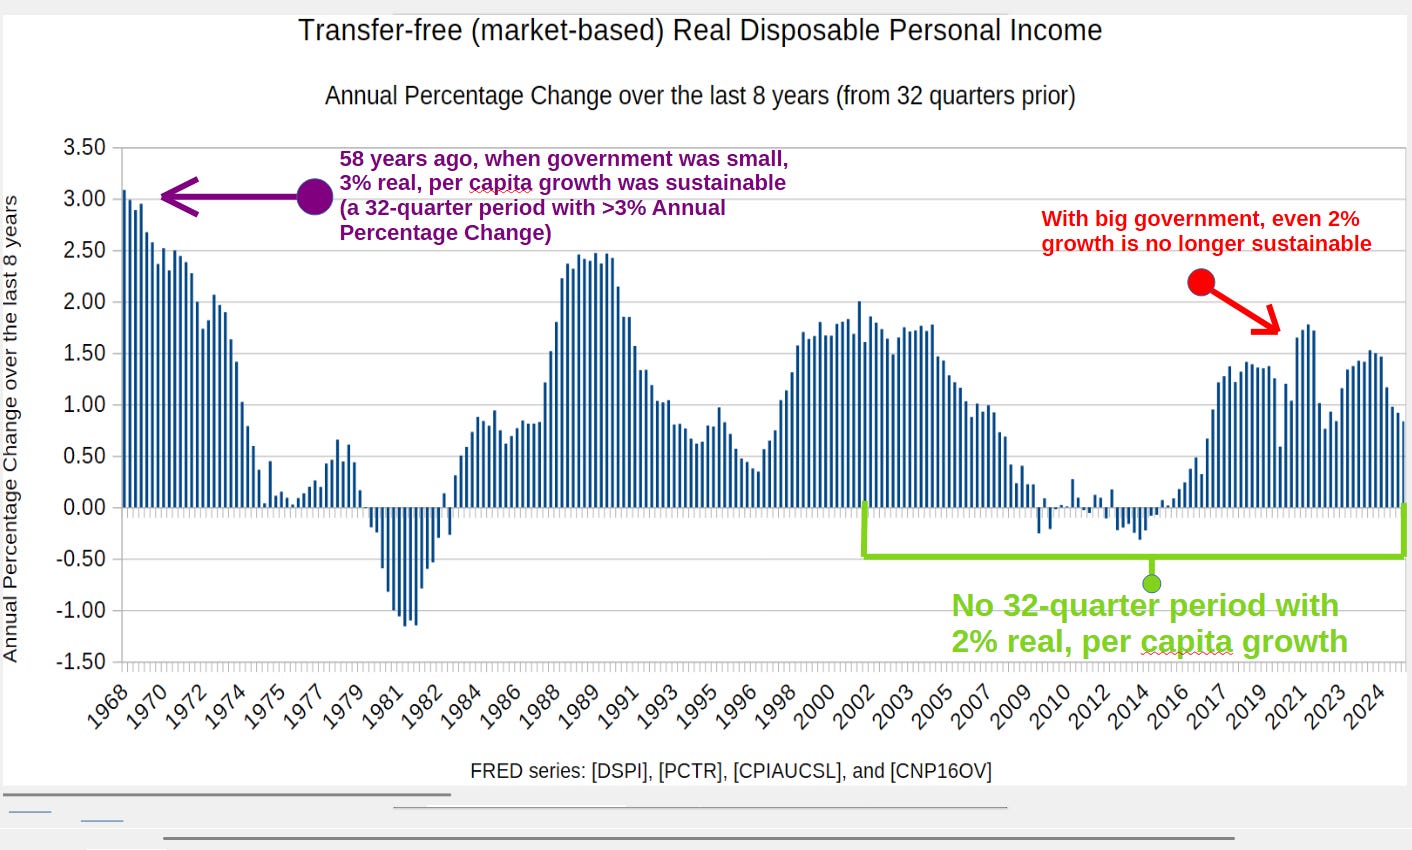
As the notes say, when operating under free enterprise, there is a chance to sustain real personal growth of 3%, but not when operating under big goverrnment. The 3rd Quarter of 2001 was the last time when there was a 32-quarter (8-year) period with 2% growth. The Police State, and the socialist Redistributive State, took over after that.
Sustained 2% growth has not been possible in America for 25 straight years now. This is what big government can do to an economy. Federal downsizing — in both the size and the scope —“should” restore American prosperity. An Article V amendments convention could “force” reform onto the the federal government.
Reference
FRED series: [ DSPI ], [ PCTR ], [ CPIAUCSL ], and [ CNP16OV ]. Go to …
https://fred.stlouisfed.org/
… and put the first acronym into the search box. Open it and hit Edit Graph and put the second one into the same series, repeat for the third and fourth acronym. Set it up so that you subtract PCTR from DSPI, that’s market income. Then divide the answer by CNP16OV. That’s market income per capita. Then divide it by CPIAUCSL, that’s a real market income per capita. After that you can set it up as a 1960 index under Edit.