The Economist estimated the 7-day average daily excess death per 100,000 weekly for almost all territories. This is the first of four planned reports on places that got such high weekly averages of daily excess deaths that they defy belief. At its worst, COVID was never more than twice as bad as flu, so when very high death occurs, you wonder.
Back in June of 1957, Asian Flu first hit Rhode Island, USA. By March of 1958, two waves and nine months later, there were an estimated 69,800 dead. Because the U.S. population was 172.74 million at the time, then — for those 9 months — the average daily excess death per 100,000 was 0.148.
Back in 1918, Spanish Flu broke out. The results in India were so bad that they were unlike anywhere else in the world. When the world rate of excess death during the year of 1918 is used — but excluding India — you get 1.334 average daily excess deaths per 100,000.
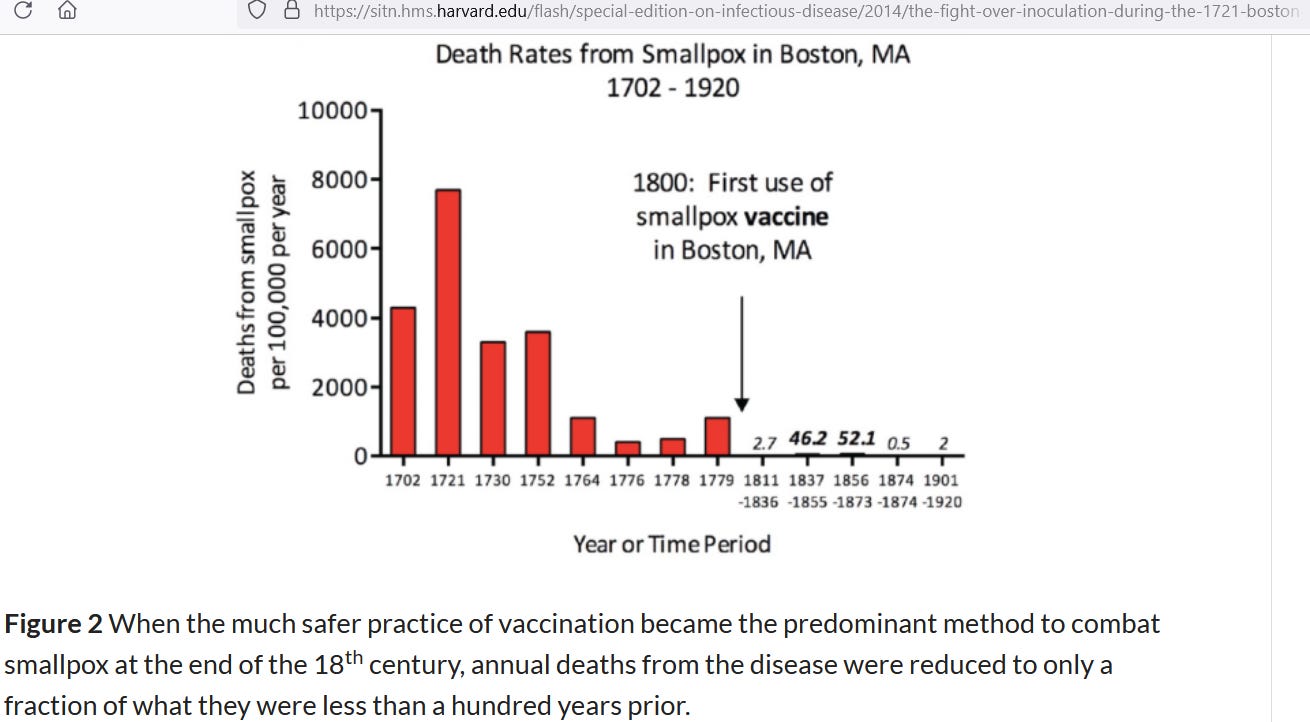
Way, way back in 1779, smallpox hit Boston, Massachusetts — resulting in an average daily excess death rate of 2.74 per 100,000.
For 4.5 years from mid-1914 to near the end of 1918, the world was at war (WWI). The losing side of the war — the so-called Central Powers — had a total population of 143.1 million but lost over 7 million lives in those 4.5 years. That’s more than 4 times the rate that the winning side lost.
When worked out to an average daily death per 100,000, the Central Powers together experienced an average daily excess death per 100,000 of 3.043. With these 4 historic examples of high excess death, we now turn to COVID in Romania:
The red line is a weekly (7-day) average of daily excess deaths, but the 4 horizontal black lines are averages across longer timespans of at least 9 months. But with a disease not more than twice as bad as flu, even the weekly excess death should have never gotten anywhere close to the death rate on the losing side of a world war.
NOTE: Compared to a weekly mean value for excess death, the peak weekly value often sits 2 to 6 times higher than the 52-week average weekly excess death value — peak-week values are typically 2 to 6 times the value of mean. Note how Romania’s peak week of excess death sits 3 times higher than the mean of the 1918 Spanish Flu.
Evidence suggests that a respiratory disease is not responsible for the outstanding weekly peaks in average daily excess deaths that were seen in Romania. The more likely explanation for the very high historic excess death is the COVID shot. As a teaser, the other 3 nations that I have planned to be reporting on next are even worse.
Reference
[Smallpox in Boston in 1779 led to 1,000 yearly deaths per 100,000] — December 31, 2014. Special Edition on Infectious Disease. The Fight Over Inoculation During the 1721 Boston Smallpox Epidemic. https://sitn.hms.harvard.edu/flash/special-edition-on-infectious-disease/2014/the-fight-over-inoculation-during-the-1721-boston-smallpox-epidemic/
[16,543,185 died in 4.5 years of fighting, from nations whose sum total of population was 960 million — but losing side had it over 4 times worse than winning side did] — World War I casualties. Available: https://www.census.gov/history/pdf/reperes112018.pdf
[Excess death rate due to Spanish Flu, excluding India, was 4870 per million in 1918 and 1010 per million in 1919] — Spreeuwenberg P, Kroneman M, Paget J. Reassessing the Global Mortality Burden of the 1918 Influenza Pandemic. Am J Epidemiol. 2018 Dec 1;187(12):2561-2567. doi: 10.1093/aje/kwy191. PMID: 30202996; PMCID: PMC7314216. https://www.ncbi.nlm.nih.gov/pmc/articles/PMC7314216/
[(1957 Asian Flu) “The second wave was particularly devastating, and by March 1958 an estimated 69,800 deaths had occurred in the United States.”] — https://www.britannica.com/event/1957-flu-pandemic
[Estimated daily excess deaths during COVID-19 per 100k people] — The Economist. https://ourworldindata.org/excess-mortality-covid


