

Public Choice Theory is something that can explain why governments grow too big, eventually reaching a tipping point when society begins to rip apart at the seams. The COVID debacle helps to settle an internal debate among Public Choice Theorists:
Do we have Big Government because people wanted it, or because entrenched bureaucrats and their cronies wanted it? Is Big Government more of a loving Nanny State helping those least fortunate, or is it more like a reciprocal cartel of “payback-patronage” which even borders on being akin to an organized crime ring?
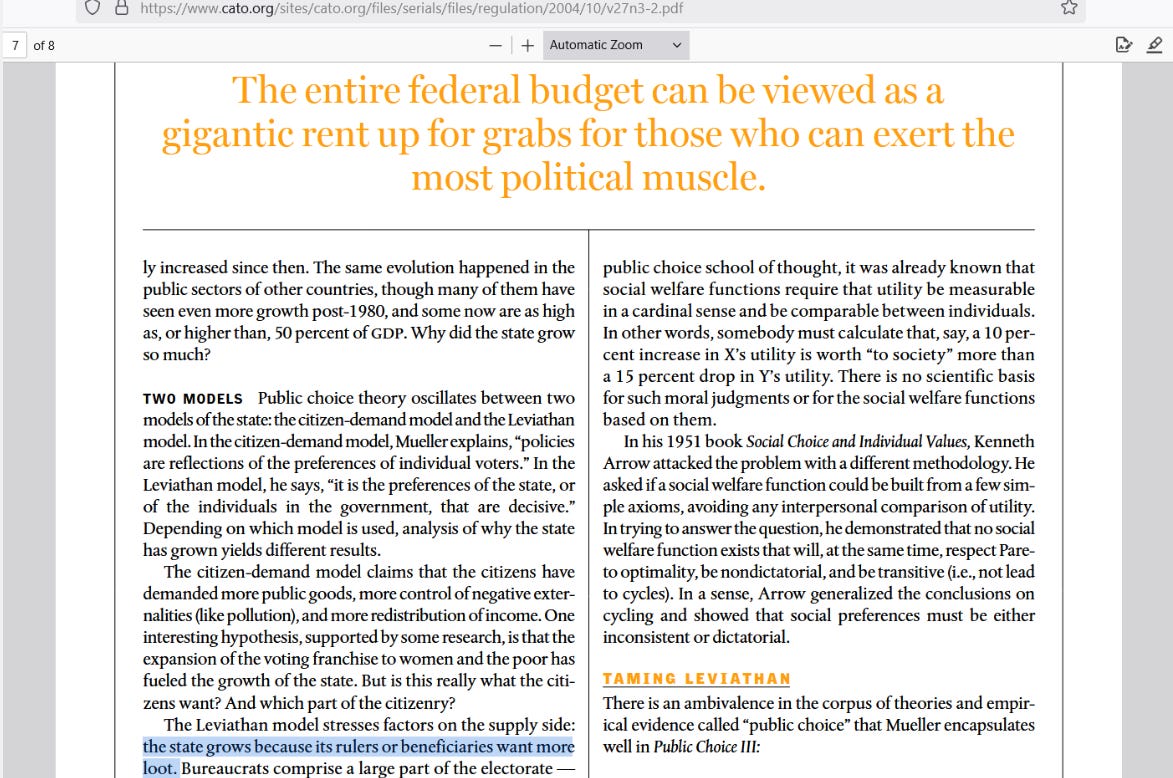
COVID taught us that it is the latter: sheer government size indicates corruption. COVID helped to vindicate a bold claim made in an essay about Public Choice Theory, published by the Cato Institute:
But if government size represents the level of government corruption, then it would be good to find a solution. A good first step is to measure the size of the problem. To evaluate different sizes of government, it can be helpful to compare what a government spends to the sum total of private sector wages earned.
Private wages afford individuals with the luxury of making more personal choices while they get on with their lives. When wages are the largest share of income (much larger than business profits or government spending), then the people are happy and free and friendly, because they have so much personal control over their future.
But if the government is the primary allocator of resources, then back-room deals can be made and the general funds can be funneled into special private interest groups comprised of government insiders and other beneficiaries of government growth. Here is a chart showing business profits, wages earned, and government spending:
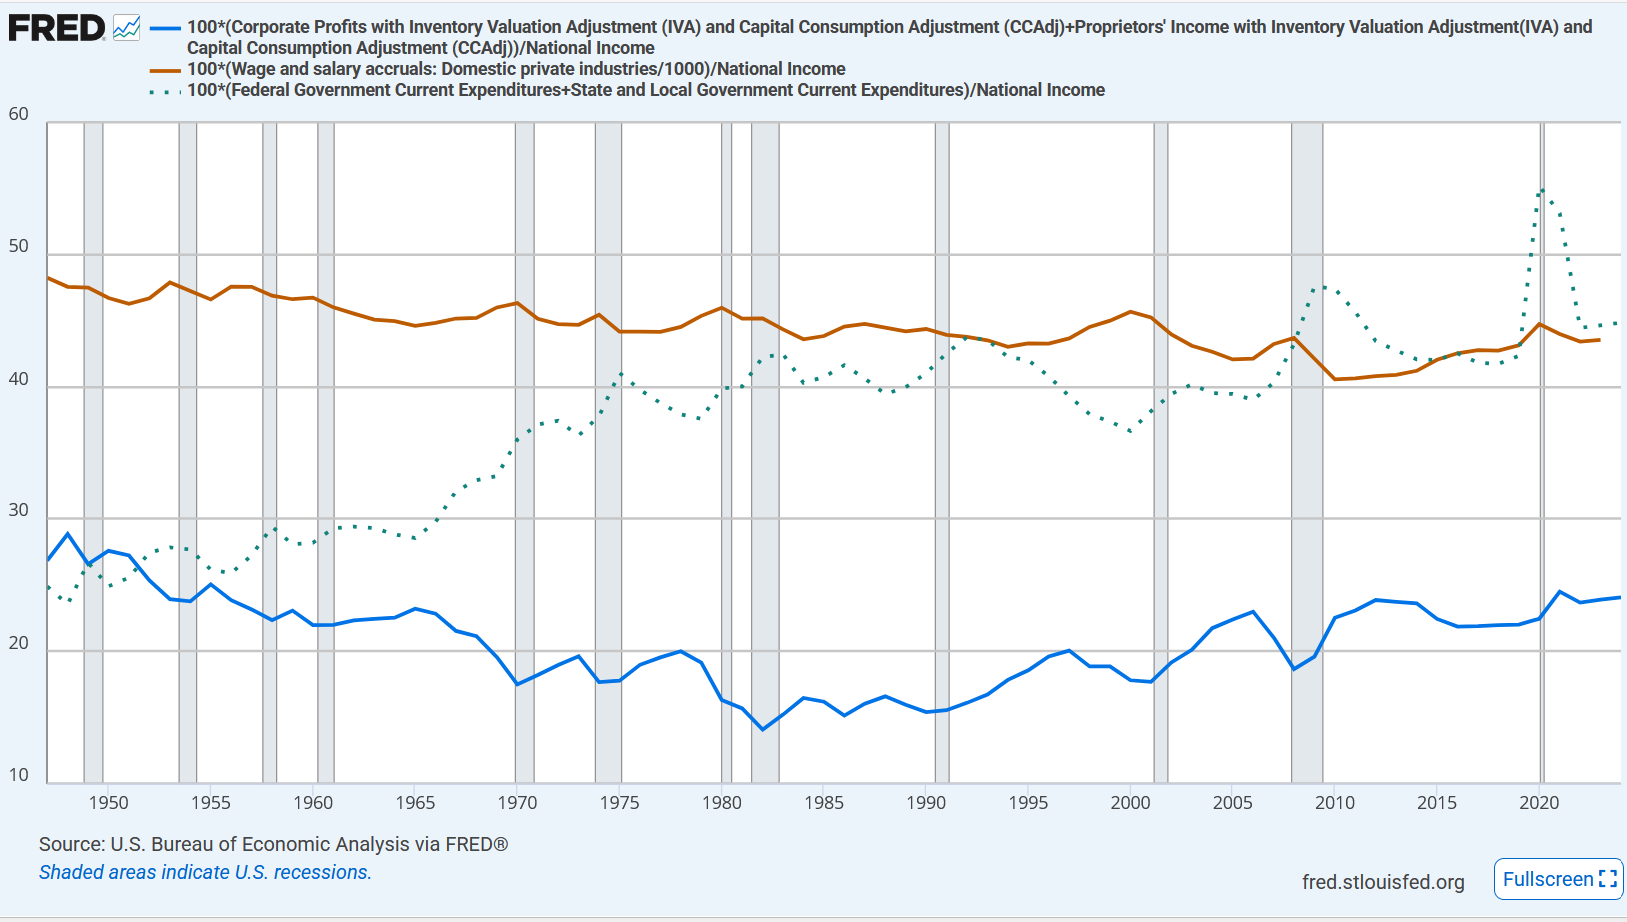
The red line represents private sector wages earned, expressed as a percentage of national income. The blue line represents the sum of corporate profits and proprietary incomes (business profit for the self-employed and for partnerships: “unincorporated businesses”). That is also expressed as a percentage of national income.
The dotted line represents the sum total of all levels of government spending: federal, state, and local. While it is expense rather than income, in order to remain consistent, it, too, is represented as if it is a “percentage share of nation income.” In 1947, wages earned in the private sector were twice the sum of all levels of government spending:
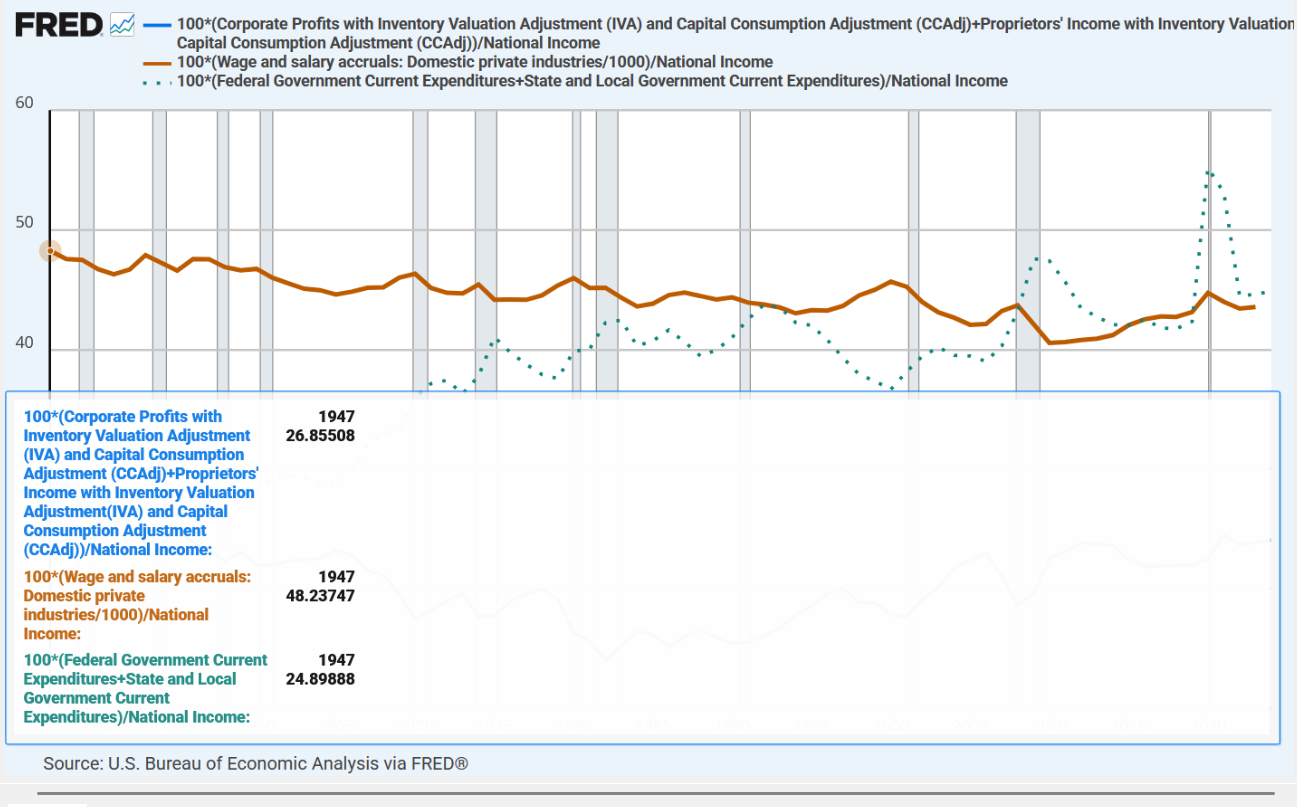
Even the sum total of business profits (blue) — at 26.9% of national income — were higher than the sum total of all levels of government spending (24.9%). Under such a circumstance, not much corruption and institutionalized looting and harm exist (yet). But as government grows, institutionalized looting and harm ramp up (e.g., COVID).
Things got really bad under the Obama administration:
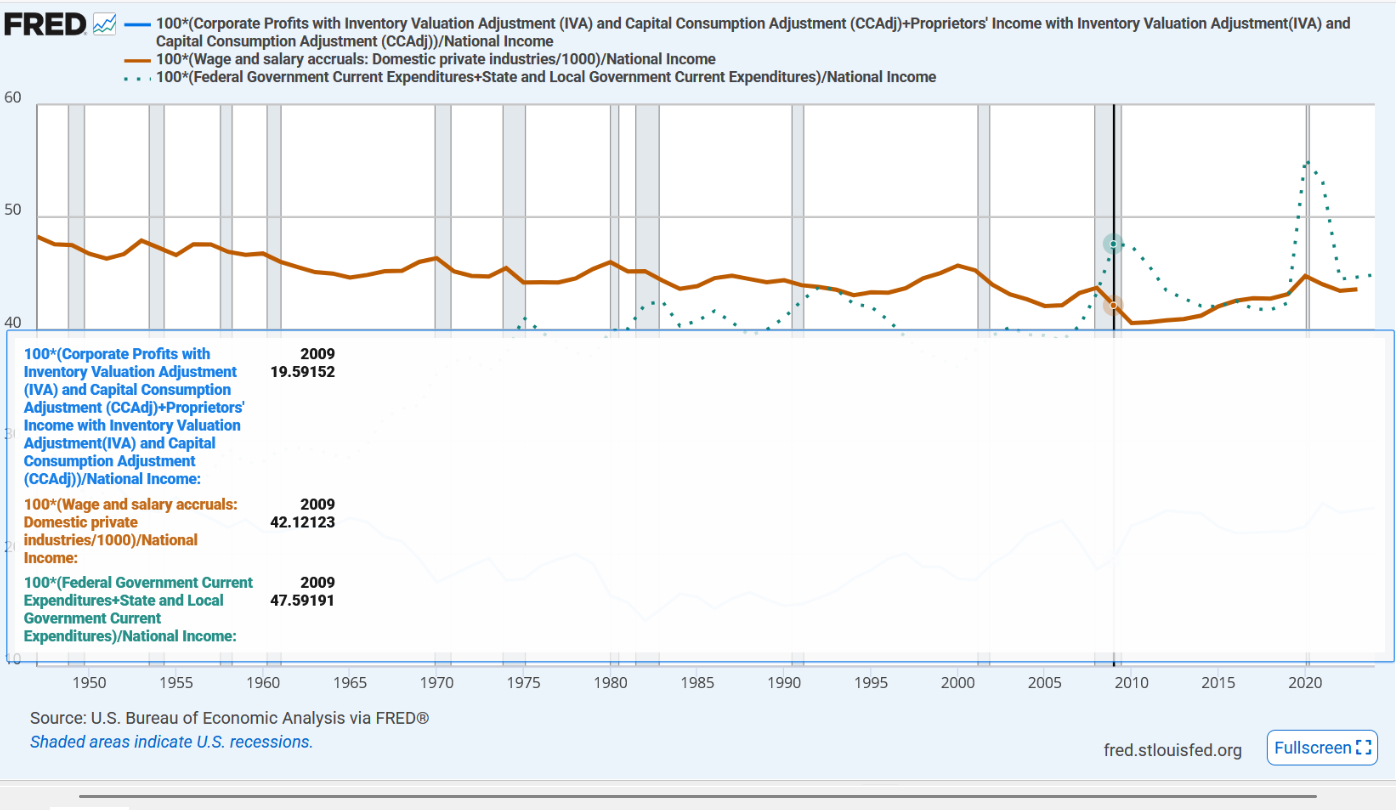
For the first time in U.S. history, the sum total of government spending exceeded the sum of all wages earned in the private sector: Government became our nation’s “largest consumer.” But though hard to believe, things got even worse under COVID:
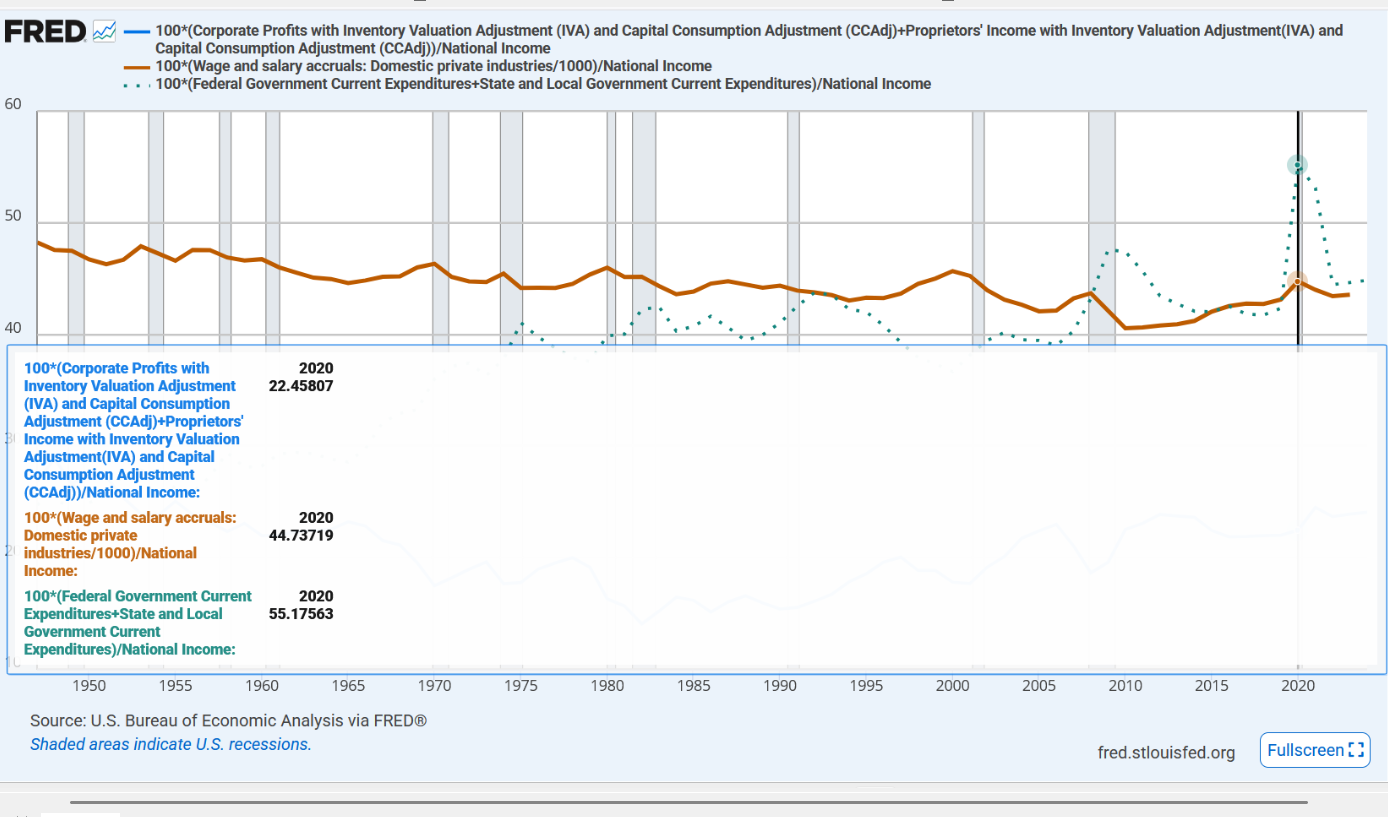
Government spending reached a level equivalent to 55% of national income. Another way to put this is that 55 cents of every dollar of income for individuals was coming from the government, and not from the individuals exercising responsibility and creativity and productivity and innovation in a free and growing marketplace.
By 2023, government was still the primary consumer in the USA:
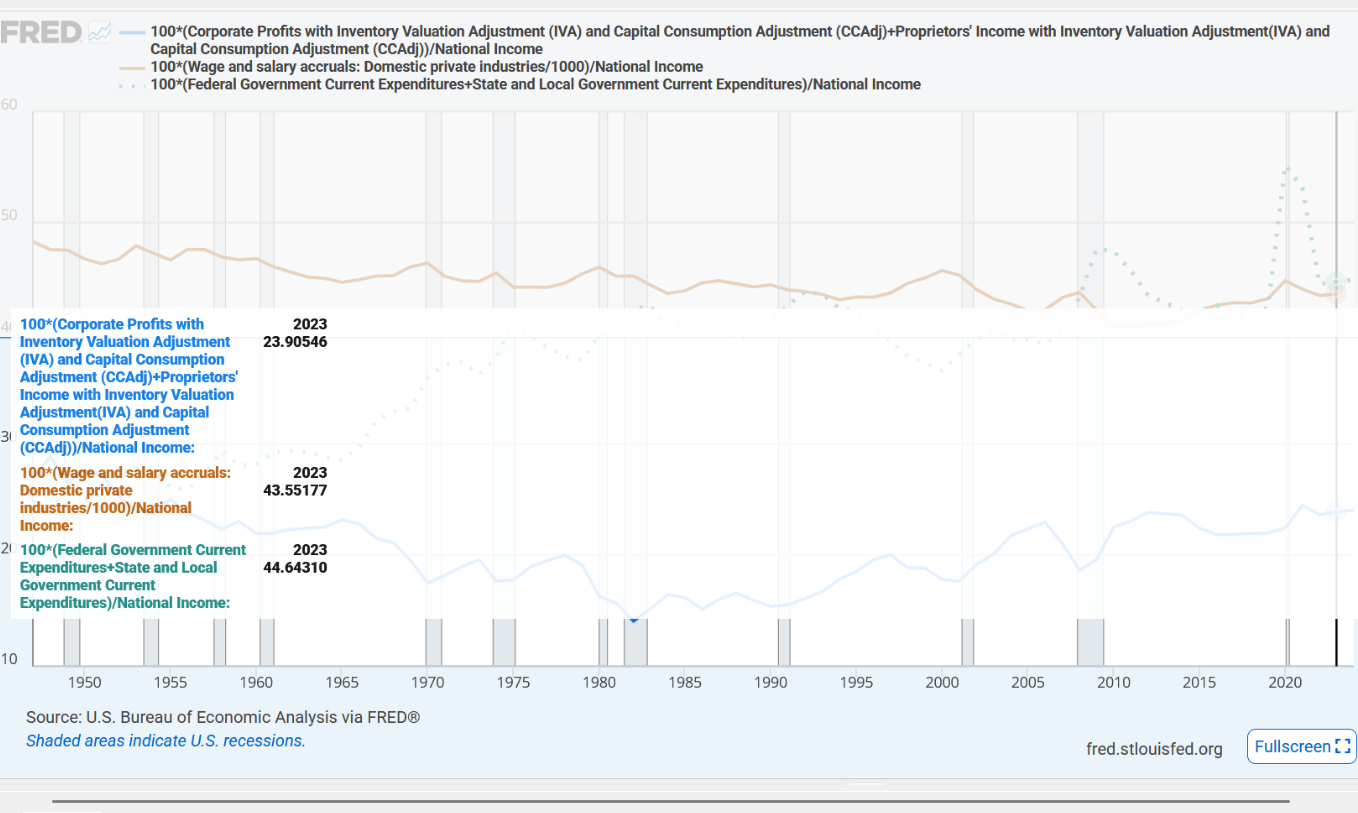
But we have got to find a way to get back to the ratios found back in 1947. And even though Public Choice Theory reveals that we will experience intense push-back from entrenched bureaucrats and looting cronies who have amassed tremendous personal power over many, many people — we have to do it. Our future depends on it.
Even our children’s future depends on the choices that we make in this generation.
Reference
Cato Institute (an essay on Public Choice Theory). https://www.cato.org/sites/cato.org/files/serials/files/regulation/2004/10/v27n3-2.pdf
U.S. Bureau of Economic Analysis, Corporate Profits with Inventory Valuation Adjustment (IVA) and Capital Consumption Adjustment (CCAdj) [CPROFIT], retrieved from FRED, Federal Reserve Bank of St. Louis; https://fred.stlouisfed.org/series/CPROFIT
U.S. Bureau of Economic Analysis, Proprietors' Income with Inventory Valuation Adjustment(IVA) and Capital Consumption Adjustment (CCAdj) [PROPINC], retrieved from FRED, Federal Reserve Bank of St. Louis; https://fred.stlouisfed.org/series/PROPINC
U.S. Bureau of Economic Analysis, National Income [NICUR], retrieved from FRED, Federal Reserve Bank of St. Louis; https://fred.stlouisfed.org/series/NICUR
U.S. Bureau of Economic Analysis, Wage and salary accruals: Domestic private industries [A4103C0A144NBEA], retrieved from FRED, Federal Reserve Bank of St. Louis; https://fred.stlouisfed.org/series/A4103C0A144NBEA
U.S. Bureau of Economic Analysis, Federal Government Current Expenditures [AFEXPND], retrieved from FRED, Federal Reserve Bank of St. Louis; https://fred.stlouisfed.org/series/AFEXPND
U.S. Bureau of Economic Analysis, State and Local Government Current Expenditures [ASLEXPND], retrieved from FRED, Federal Reserve Bank of St. Louis; https://fred.stlouisfed.org/series/ASLEXPND
Thank you so much for bringing this type of information to those of us, myself included, that had no idea. Plus you put it all into an easy to understand, short but succinct article along with charts that visually hit the mark. Thank you again Deep.