
Moderna Shots vs. Flu Shots
Post #1678

John Hines hosts Weekly Briefing at the One America News network, and he recently interviewed Senator Ron Johnson about just how dangerous the modified-RNA COVID shots are for the people who take them. This post is meant to follow-up on the subject and to produce meaningful visual aids helping to clarify the picture.
Looking over past flu seasons, you discover that 1.548 billion flu shots went out during the 11 flu seasons running from 2008-2019:
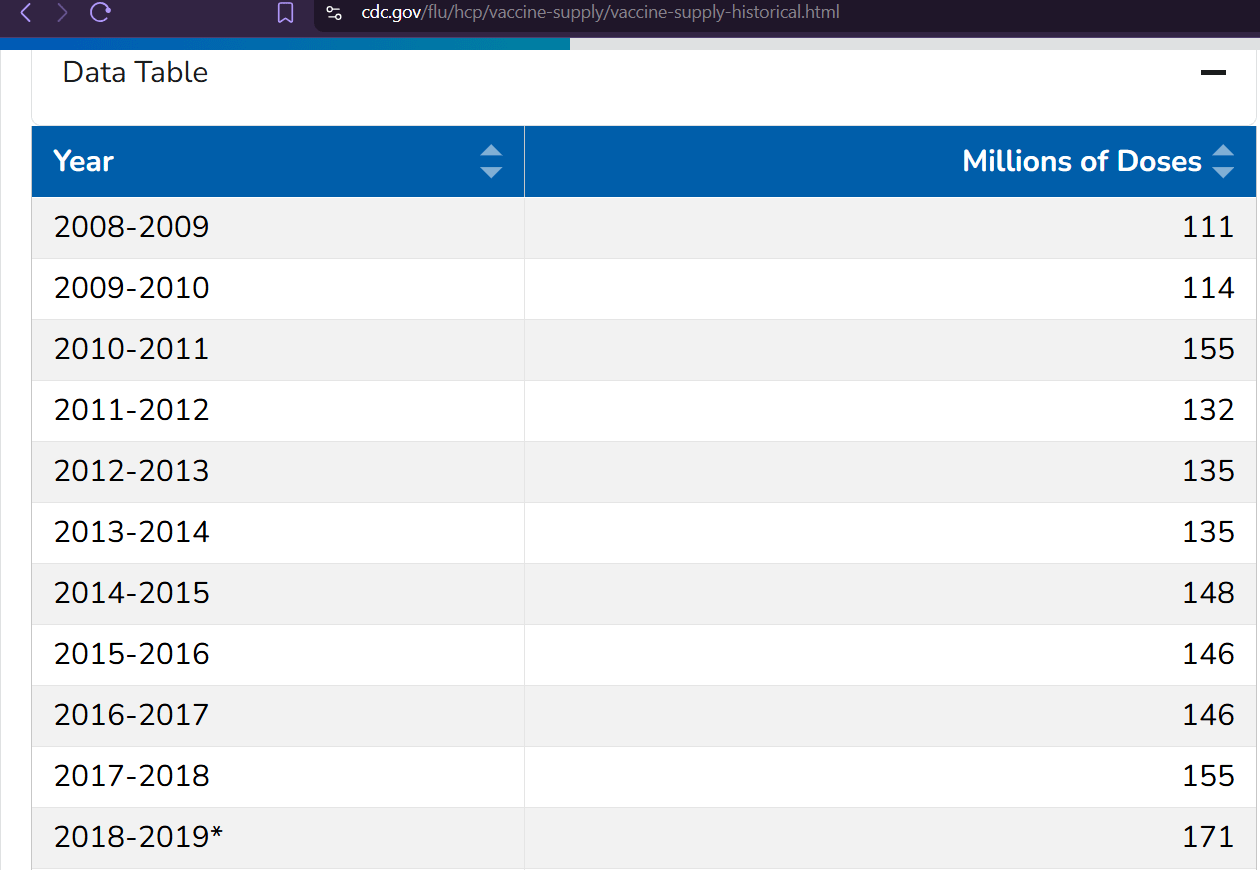
Checking the VAERS database for fatal adverse event reports tied to those particular flu shots, you will discover 417 of them:
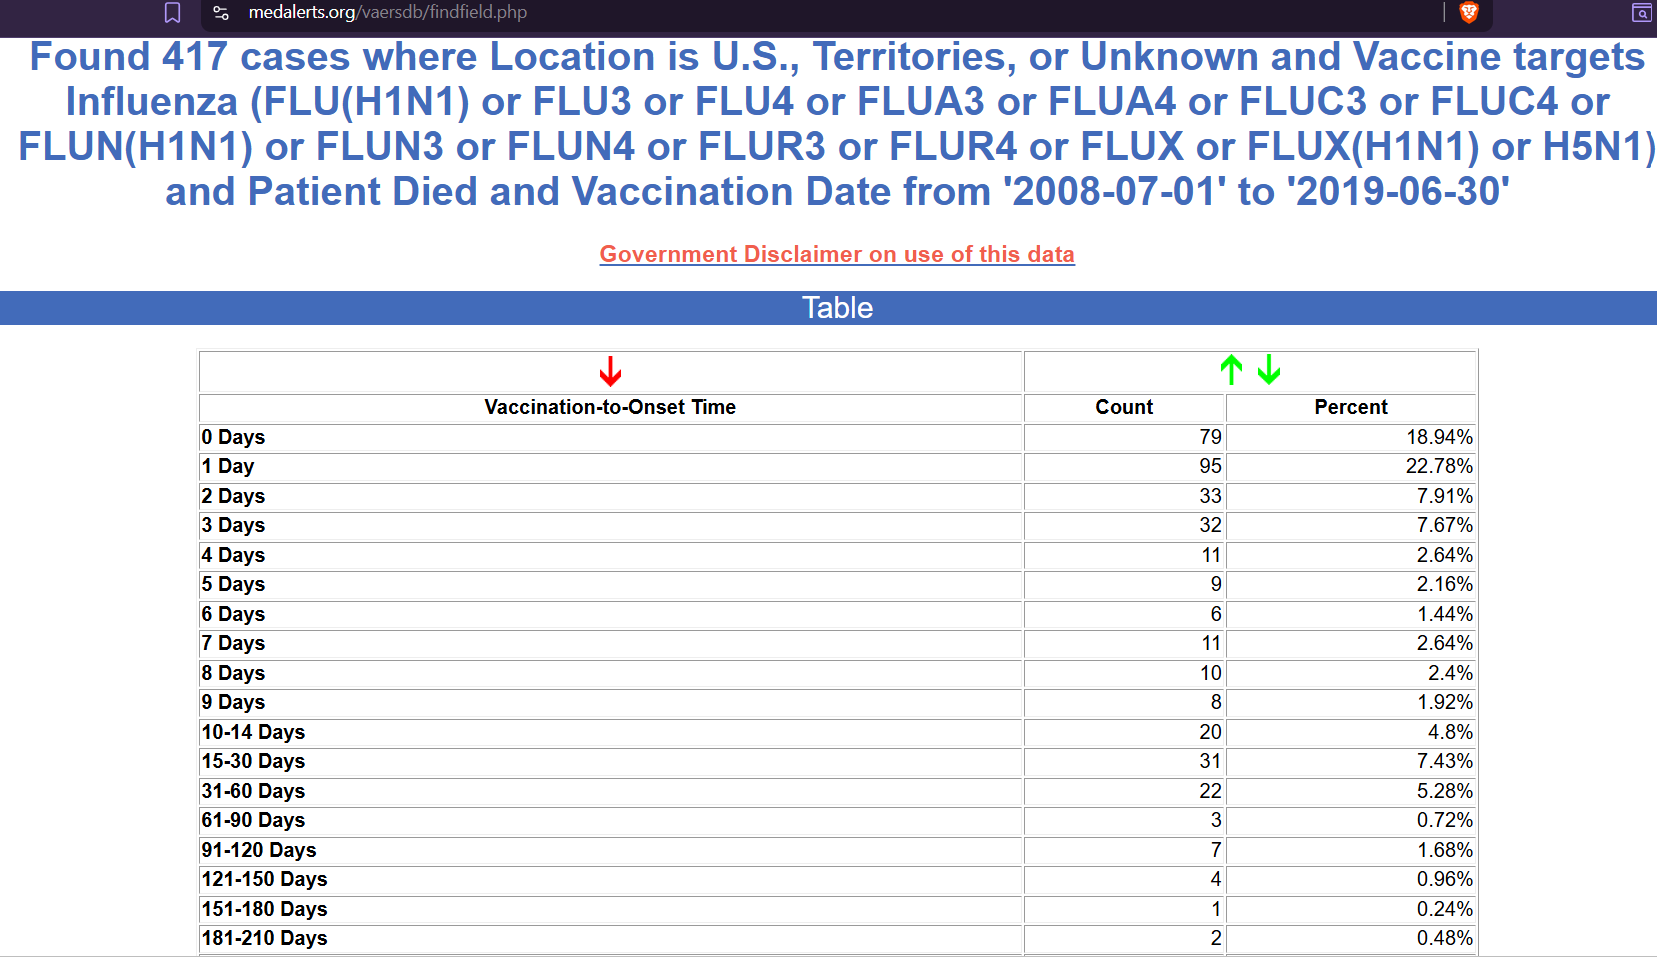
[click to enlarge]
That makes for a fatal adverse event “reporting rate” of 0.27 fatal adverse event reports per million doses of flu shots given out.
Then we can check Moderna. OurWorldInData reveals that 251.85 million doses of Moderna had been delivered up to late March 2023. Let’s check VAERS for the fatal adverse event reports for those particular shots:
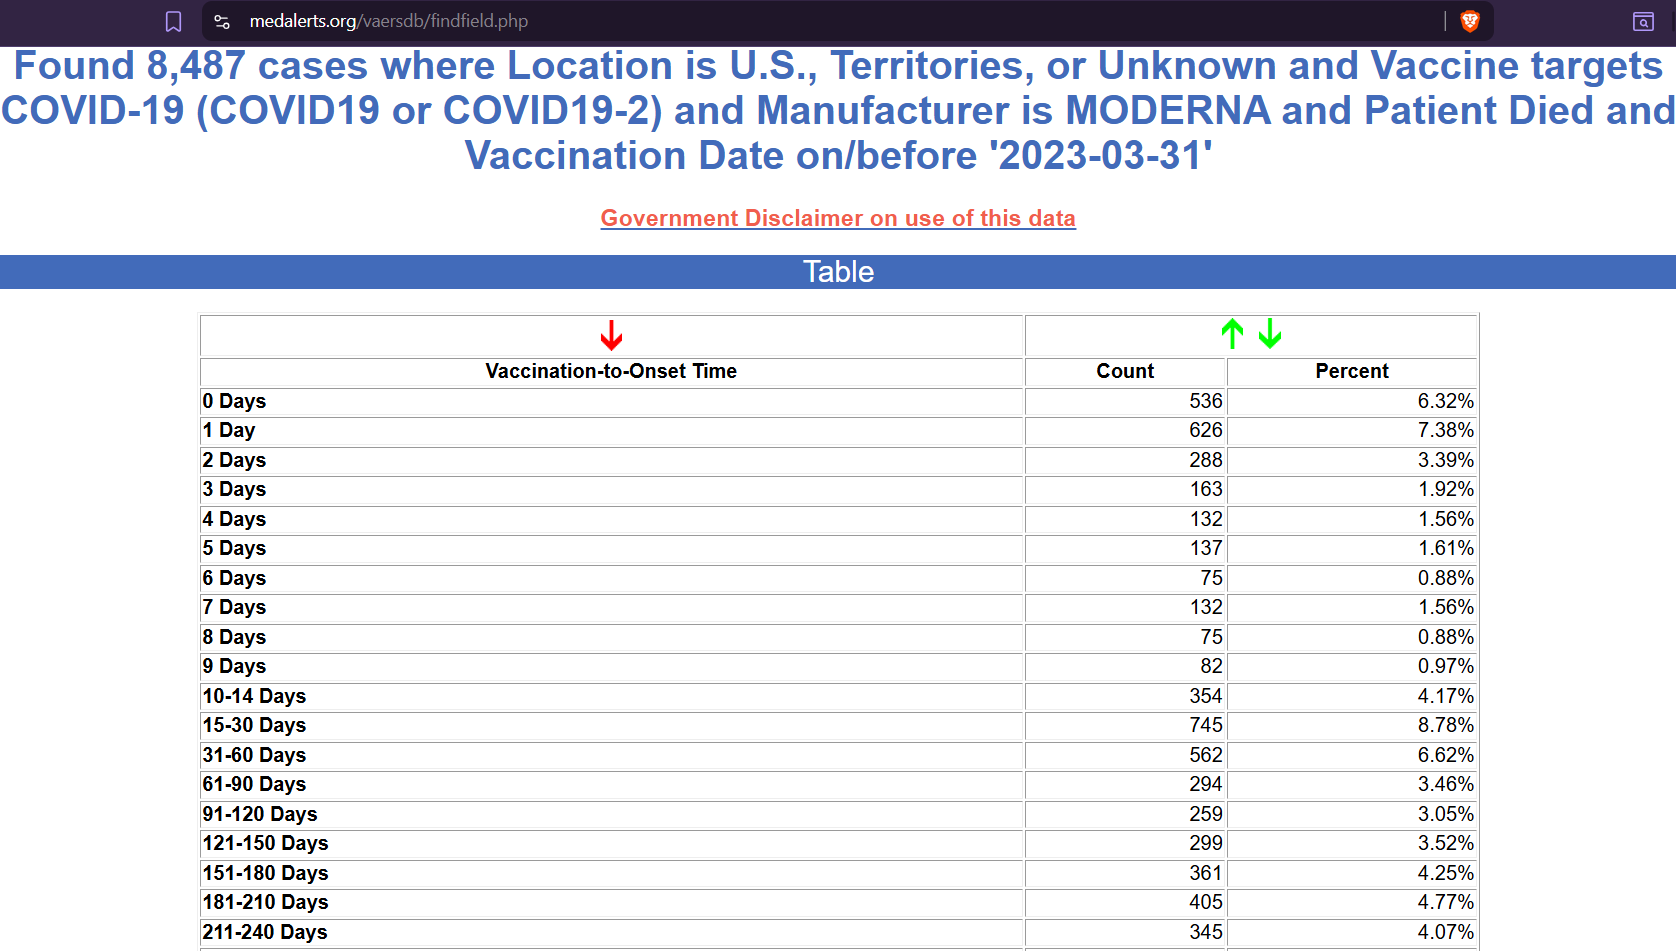
[click to enlarge]
That makes for a fatal adverse event “reporting rate” of 33.7 fatal adverse event reports per million doses of Moderna shots given out.
But critics and detractors may claim that the hype surrounding COVID led to a situation where individual persons became 3x as likely to report an adverse event — a tripling of the “propensity to report.”
Incorporating this assumption into the analysis, here is what came in for flu shots (at left) and what came in for Moderna shots (at right), along with what would have been expected to come in, if the critics and detractors are right, and the people really were 3x as likely to submit a report to VAERS during COVID:
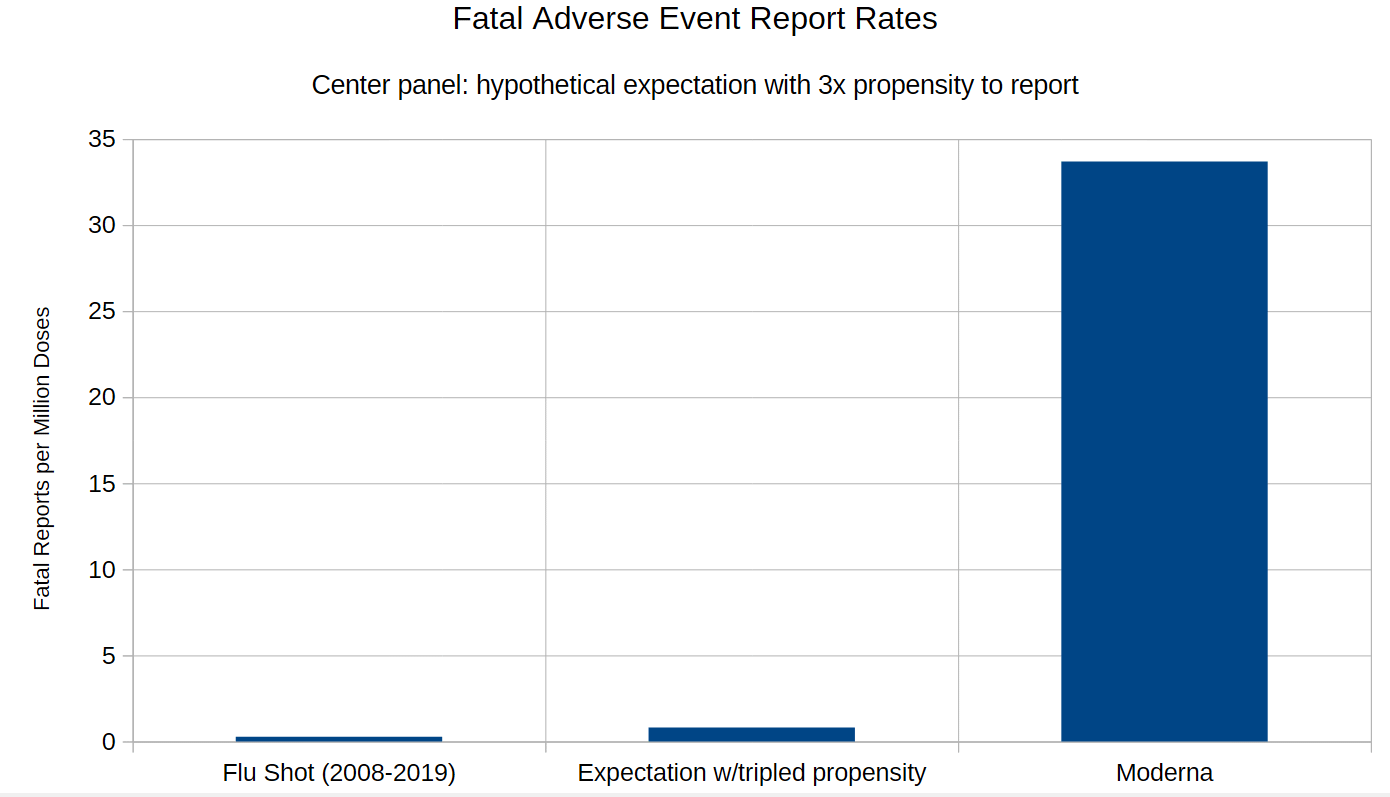
As you can see, even tripling the “propensity to report” does little-to-nothing to cover the distance between the reports of death after flu shots versus the reports of death after Moderna shots. But the VAERS database does have an uncertainty associated with it: the usual rate of capture of true events which did occur in the background.
Spontaneous reporting systems tend to capture somewhere between 2% and 18% of the actual events which occur in the background. When an 18% capture rate is assumed, then you get a low estimate of the actual events associated with something. When a graph is formed using that high rate of capture, this is what results:
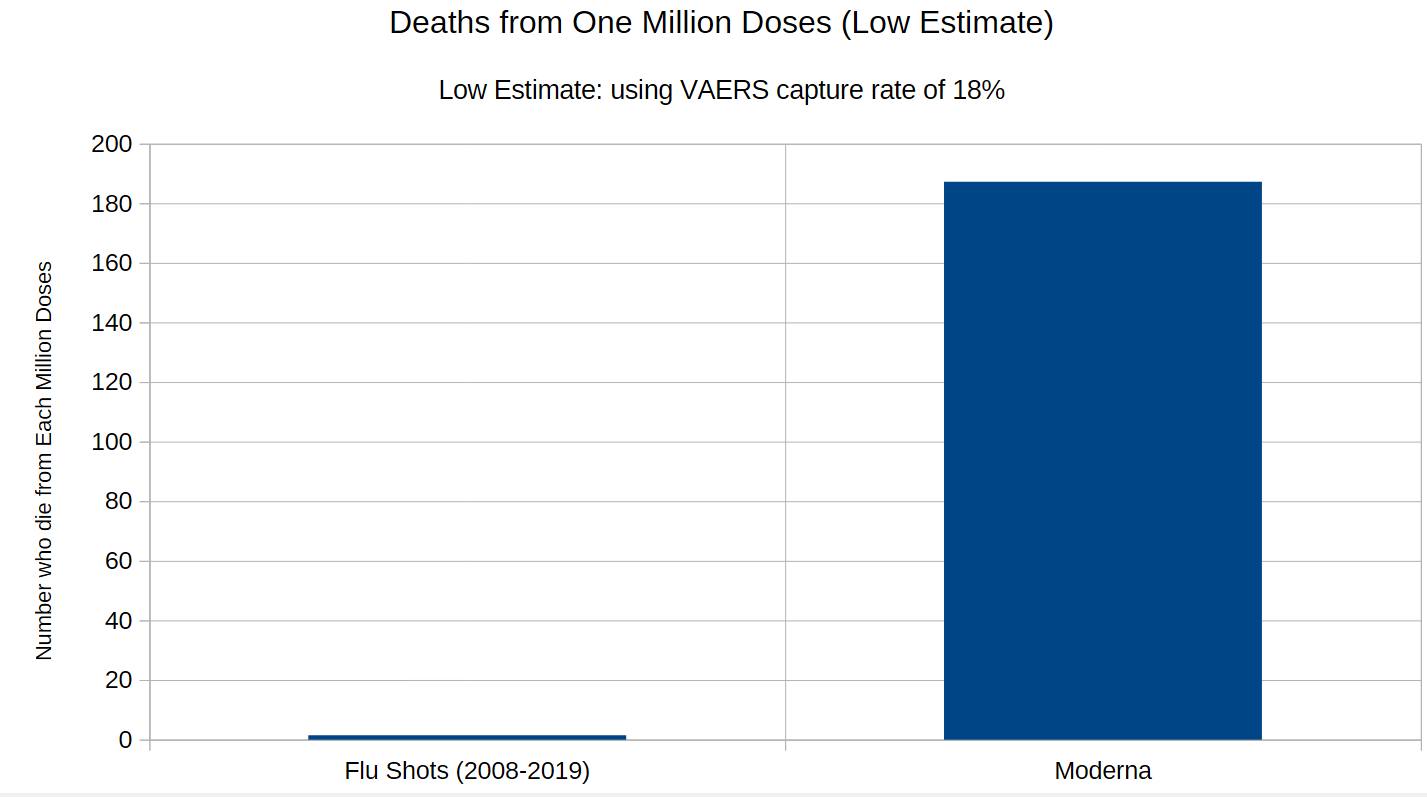
As you can see, being a low estimate, then there is very much confidence in the following statement:
“ For each million who take Moderna shots, over 180 of them will die. “
Now let’s relax the assumption that the VAERS system is so good that it is able to capture a full 18% of all of the events that were occurring in the background, and let’s use a more conservative estimate on the rate of capture of just 2% of the actual events which did occur in the background:
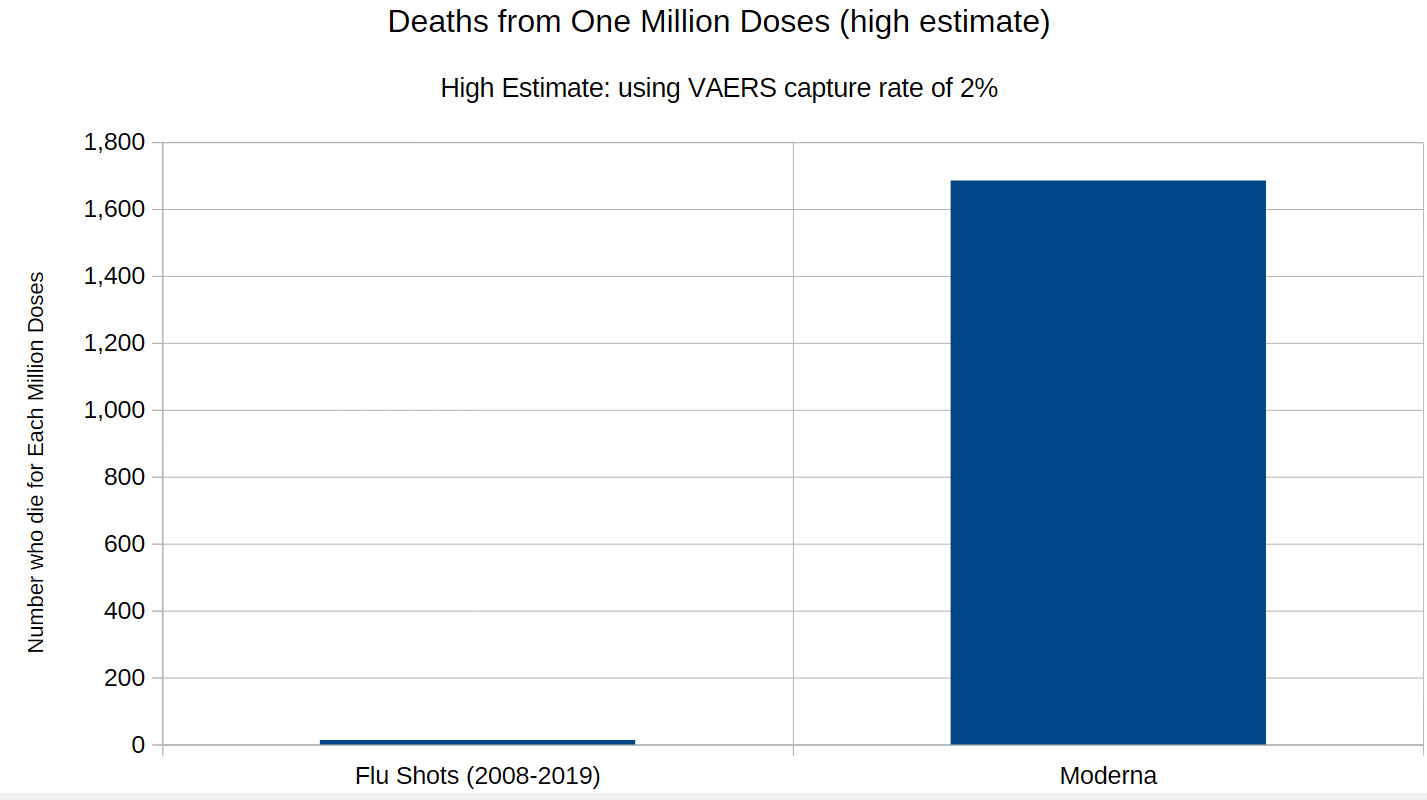
This leads to a situation where 1,685 persons will die after a million persons are given a shot from Moderna: one death for each 593 doses. Even at this high estimate of actual events (from an assumed low rate of capture by VAERS), the flu shots still only led to one death for each 74,245 flu shot doses administered.
The headline estimate of Moderna is that it is 125x more dangerous than flu shots are. But if you assume a tripled propensity to report due to the hype surrounding COVID, then you still have the situation where Moderna was 42x more dangerous than a flu shot. But COVID was never 42x more dangerous than seasonal flu.
COVID was never even over twice as dangerous as seasonal flu. If the disease is not even twice as dangerous, but the “treatment” is a minimum of 42x as dangerous (and up to 125x as dangerous), then someone has some explaining to do.
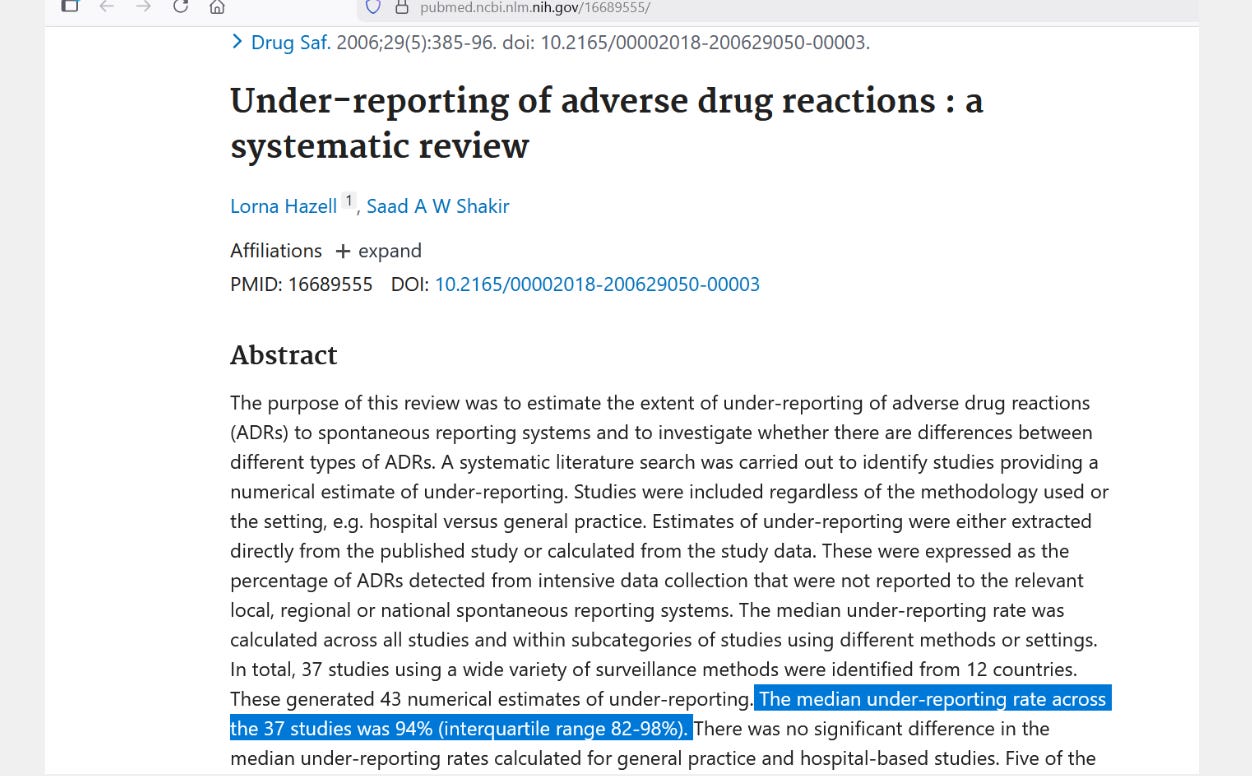
With under-reporting of 82% - 98%, then you have a system that captures 2% -18%:
Reference
[251.85 million Moderna doses in USA by 22 Mar 2023] — OWID. https://ourworldindata.org/covid-vaccinations
[8,487 Moderna death reports in USA up to March 2023] — MedAlerts. https://www.medalerts.org/vaersdb/findfield.php
[yearly uptake of flu shots] — CDC. https://www.cdc.gov/flu/hcp/vaccine-supply/vaccine-supply-historical.html
[capture rates of spontaneous reporting systems usually run from 2% to 18%] — Hazell L, Shakir SA. Under-reporting of adverse drug reactions : a systematic review. Drug Saf. 2006;29(5):385-96. doi: 10.2165/00002018-200629050-00003. PMID: 16689555. https://pubmed.ncbi.nlm.nih.gov/16689555/