

More on Deaths among Young in New Brunswick
More on Deaths among Young in New Brunswick
Re-analysis using a 62-week baseline

As shown on Jessica Rose’s substack, weekly death data in New Brunswick are inexplicable. Using data available from the Canadian government, I re-worked an earlier analysis which was unfortunately published with an error in it (first 91 weeks of data used as baseline, but chart says “98” were used).
To clear up confusion this time, I use a green bracket to show the baseline used in order to obtain mean weekly death counts (6.0) for those under age 45, as well as the standard deviation of weekly death counts (3.2).
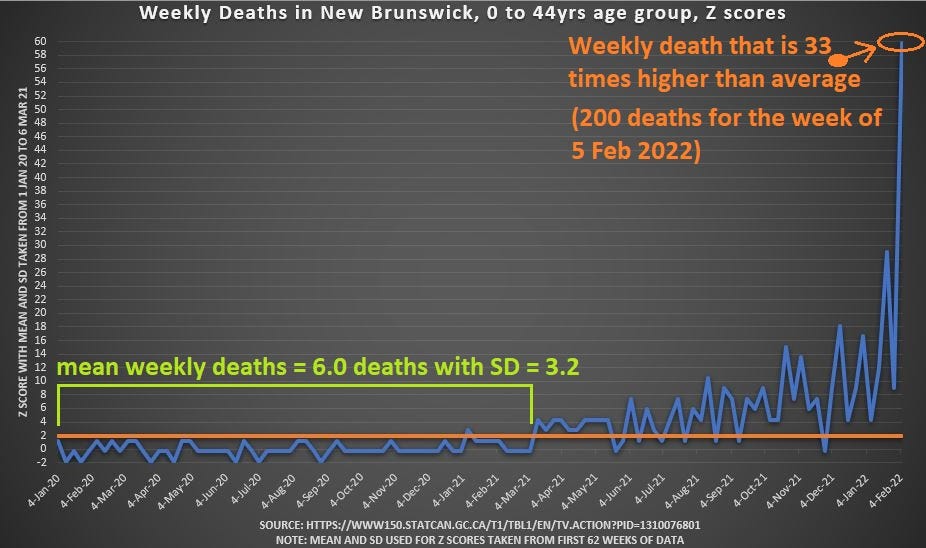
As shown at the right edge of the green bracket, weekly deaths in the young began rising above the 95% upper bound of expected weekly deaths (above Z=1.96).
As shown in the vaccine uptake rate for Canada in general below, the right edge of the green bracket is when vaccine uptake began to take off in Canada in general in April 2021, reaching a ~1% (0.99%) daily share of the Canadian population receiving COVID vaccination each day, by 22 May 2021.
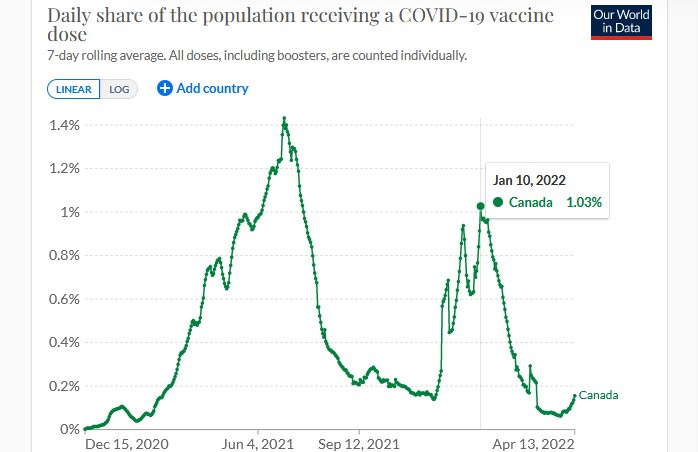
Graph available at: OurWorldInData COVID Vaccinations page
This high rate of vaccine uptake, when a full 1% of the population is getting vaccinated every 24 hours, wouldn’t happen again until 10 Jan 2022 (as accentuated in the graph above). This second peak in daily vaccine uptake precedes the steep rise in death among young, which reached 33 times the average weekly death during the week of 5 Feb 2022.
The notable pattern is that, when the daily vaccine uptake rate approaches 1% of the population, deaths begin to rise in the several weeks after vaccine uptake first rose. This temporal association, where high vaccination leads into high death, suggests that the vaccines are harmful.
A failure of health officials to acknowledge the temporal association of vaccine uptake and subsequent death surges would be at least a failure of pharmacovigilance, if not something worse.