New (& improved) Excess Death Method
A normative method, instead of arbitrary averaging
Conventional methods of computing excess deaths involve arbitrary averaging. A baseline is developed from a few prior years, and whatever mortality that had existed in that baseline is assumed to be a “correct” amount of mortality — so that you can use it to project forward.
In May of 2022, a group of researchers introduced a new way to compute excess death: Don’t assume that past death rates were all correct and normal and natural.
A common range of years to use for a baseline regarding excess death during COVID has been 2015 to 2019. But those years contained a couple of super-heavy flu years (both 2014/15 and 2017/18).
Why arbitrary averaging is a problem
This is problematic because even the excess death seen in flu isn’t unavoidable. Most (>50%) of annual flu deaths would likely be avoided with ample vitamin D status. If the past doesn’t represent a normative amount of death, what does?
One method to actively ignore high death in past years is to use the second-lowest death rate for each given week, out of a range of at least 5 prior years (preferably 7 prior years).
That’s what the researchers did.
I obtained all weekly deaths for all 313 weeks from 2014 to 2019, inclusive, and then I applied the “second-lowest” method on weekly death rates in order to obtain a more “proper” baseline for excess death computation. If you have 6 total years, the “second-lowest” becomes the 25th percentile of weekly death rates.
Here is that baseline of expected weekly death rates in the US:
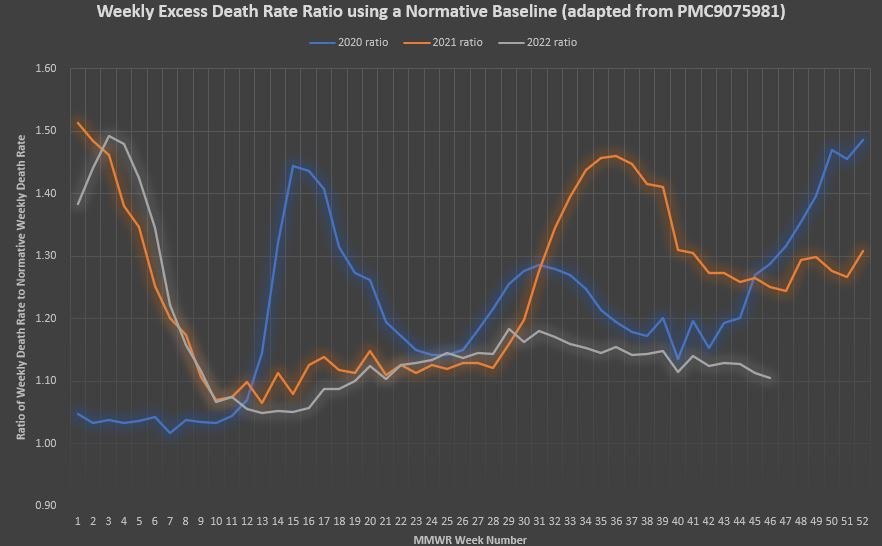
Then I took the weekly death counts from the CDC — though I did so by way of a third-party site called “US Mortality.com.” The ratio of weekly death rates (recent death rate divided by baseline death rate) for the 2.9 years of COVID is troubling:
The blue line is 2020, orange is 2021, and gray is 2022 — though 2022 only goes out to Week 46. Here is the same graph of weekly rate ratios with notes in it:
The sum total of excess death for the 150 weeks showing is 1,665,105 — which is higher than the CDC estimate, due to their estimate involving the arbitrary averaging mentioned above.
For 2020, average weekly percent excess death was 21%. For 2021, when COVID jabs were made available, average weekly percent excess death was 24.4%. For the first 46 weeks of 2022, average weekly percent excess death was 16.4%.
Compared to the World War with a higher death rate, World War I, the year of 2021 exceeded it:
World War I death caused a death rate that was 22% above baseline, while the death rate in 2021 was 24.4% above baseline.
Reference
[third-party site which claims to get the weekly death counts from the CDC] — US Mortality. https://www.usmortality.com/deaths/weekly
[A normative method for computing excess death which avoids arbitrary averaging] — Shkolnikov VM, Klimkin I, McKee M, Jdanov DA, Alustiza-Galarza A, Németh L, Timonin SA, Nepomuceno MR, Andreev EM, Leon DA. What should be the baseline when calculating excess mortality? New approaches suggest that we have underestimated the impact of the COVID-19 pandemic and previous winter peaks. SSM Popul Health. 2022 Jun;18:101118. doi: 10.1016/j.ssmph.2022.101118. Epub 2022 May 6. PMID: 35573866; PMCID: PMC9075981. https://www.ncbi.nlm.nih.gov/pmc/articles/PMC9075981/
[World War I death] — US Census Bureau. https://www.census.gov/history/pdf/reperes112018.pdf


