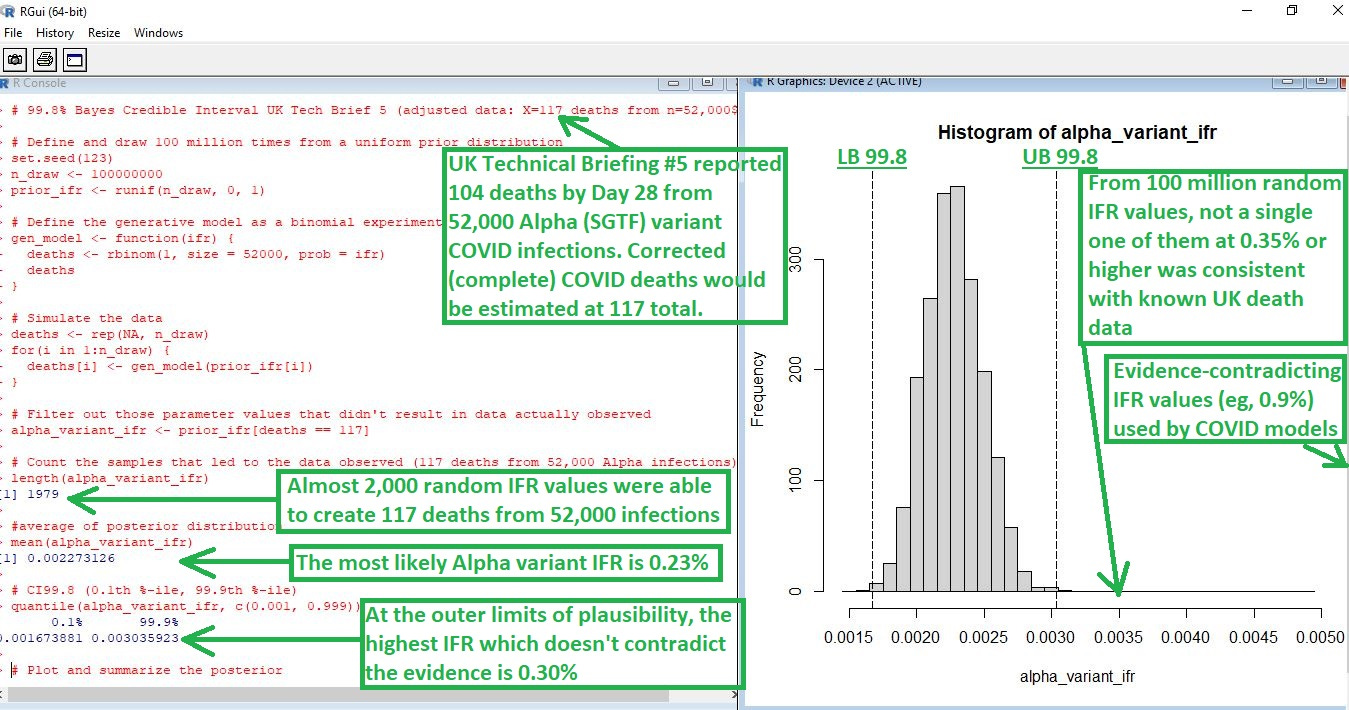
One 100-million-round Computer IFR Simulation to Rule them All
Introducing the 99.8% Bayesian Credible Interval
To estimate an inherent infection fatality rate (IFR), you have to count the deaths and infections before introducing confounders, such as vaccines. When you obtain an IFR estimate, it has to be compatible with known death data.
Pre-vaccine data from the UK became available with Technical Briefing #5, showing that non-Alpha variant COVID was pretty mild (“flu-like”), but Alpha variant was even more deadly than flu (NOTE: 0.0023 is the same as 0.23%):
[click image to enlarge]
Here is the source of data for this computer-simulated IFR:
[click image to enlarge]
Notice how it is that Alpha was the worst COVID strain in terms of IFR.
The reason to extend the credible interval out to 99.8% was to explore even the outer limits of plausibility with respect to a COVID IFR. Any IFR estimate must be consistent with known death data. Being inconsistent with actual evidence means that the estimate is “wrong.”
Here are levels of evidence which get applied to paternity court cases when making the wrong decision can be disastrous:
[click image to enlarge]
Notice how it is that, once you reach 99.8% probability, then you have practically proven your case to be the truth of the matter. The 99.8% Bayesian credible interval used in the computer simulation at top represents 99.8% probability.
It is not a mere confidence interval — as is used so often in medical research — it is something stronger than that. It allows for a probability interpretation.
Why such scrutiny?
The reason to be so meticulous about defining even the outer limits of what it is that can possibly be true of the world — by creating 99.8% credible intervals — is because COVID models are so often guilty of using IFR values which contradict the evidence.
If a second computer simulation were created to investigate the IFR value used in the Imperial College model (0.9%), then it would be shown that, in 100 million attempts to create the UK death data, all of them would fail.
If your estimate is so divorced from the evidence that it cannot even be found consistent with known data even 1 time in 100 million, then it is time to change your estimate — the inability of your estimate to be found compatible with data, even after 100 million attempts, means that your estimate is wrong.
Pitfalls of Estimation
You can obtain an IFR estimate that is higher than the true value much easier than getting one that is too low. Bad treatments, for instance, can increase the death after infection beyond what the disease would have caused.
But in order to get an IFR estimate that is below the true value, you must either “look the other way” when people die (so that you don’t count their deaths as deaths) or you must imagine a high infection prevalence which really isn’t there.
This makes lower IFR estimates “better” than higher ones, because they are more likely to represent the truth, rather than to be impacted by confounding variables such as bad medical care.
The lower estimates represent what the disease can cause. The higher estimates represent the effect of confounding factors, added onto what it is that the disease can cause. In other words,
Infection Fatality Rate estimates found by looking at the real world will have an “organic” lower bound (determined by inherent virulence) and an “arbitrary” upper bound (determined by treatment differences).
Reference
[As of 19 Jan 2021, from 52,000 COVID infections with Alpha (SGTF) variant, there were 104 deaths by Day 28 (corrected to 117 total deaths, by using upper bound estimates from Linton et. al.)] — Page 3. Epidemiological findings. UK Technical Briefing #5. https://www.gov.uk/government/publications/investigation-of-novel-sars-cov-2-variant-variant-of-concern-20201201
[“Time-to-death” model for COVID; using the 95% UB of both the mean and SD of the lognormal model that fit the actual deaths best] — Linton NM, Kobayashi T, Yang Y, et al. Incubation Period and Other Epidemiological Characteristics of 2019 Novel Coronavirus Infections with Right Truncation: A Statistical Analysis of Publicly Available Case Data. Journal of Clinical Medicine. 2020 Feb;9(2). DOI: 10.3390/jcm9020538. PMID: 32079150; PMCID: PMC7074197. https://www.ncbi.nlm.nih.gov/pmc/articles/PMC7074197/
[What level of evidence it takes to make it appropriate to talk about something as being, for at least practical purposes, “proven”] — A Few Things You Should Know About Paternity Tests (But Were Afraid to Ask). https://digitalcommons.law.scu.edu/cgi/viewcontent.cgi?referer=&httpsredir=1&article=2024&context=lawreview
[Imperial College model using an evidence-contradicting IFR of 0.9%] — Imperial College COVID-19 Response Team. Report 9: Impact of non-pharmaceutical interventions (NPIs) to reduce COVID-19 mortality and healthcare demand. https://www.imperial.ac.uk/media/imperial-college/medicine/sph/ide/gida-fellowships/Imperial-College-COVID19-NPI-modelling-16-03-2020.pdf
[recent COVID model which requires an IFR of at least 0.9% again, just like the Imperial College one did] — Two Years of U.S. COVID-19 Vaccines Have Prevented Millions of Hospitalizations and Deaths. https://doi.org/10.26099/whsf-fp90


