After finding a monthly safety signal for autism from MMR vaccines for February 1995, in a follow-up report on MMR versus autism, a statistical test using the proportion of all autism reports to VAERS which are comprised of MMR vaccine was performed to rule-out the null hypothesis that no link exists between MMR vaccines and autism.
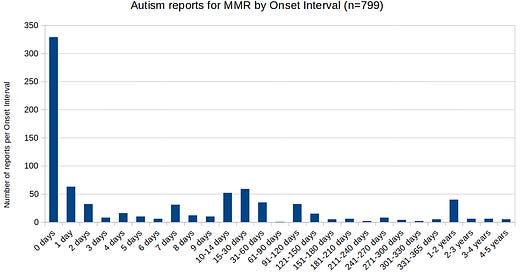
But a second way to reject the null hypothesis that MMR vaccines have no link to autism is to examine the time of autism onset after receiving the MMR vaccine. Here are the counts of reports found in certain time intervals after a dose:
Notice how it is that, out of ~800 reports with time intervals out to 5 years or less, over 300 cases of autism began on Day 0 (the same day that MMR vaccine was given). This suggests quick effects. Though the intervals along the bottom are not of equal length, if reporting had been perfectly uniform for 5 years post-dose, then it’d look like this:
But uniform reporting is “too strong” of a null hypothesis, and may be criticized as being a “straw man” which was meant to fall-over or crumble when vigorously tested. Using equal-length intervals, here is how a uniform distribution would look for eleven 30-day intervals (approximating 11 months):
Using the first eleven intervals, each 30 days long (and involving 737 VAERS reports of autism for MMR vaccine), a more conservative assumption is that there would be some decay in the tendency to report to VAERS as time went on. If MMR had no link to autism, but if reports nonetheless decayed by exactly 40% each month, you get this:
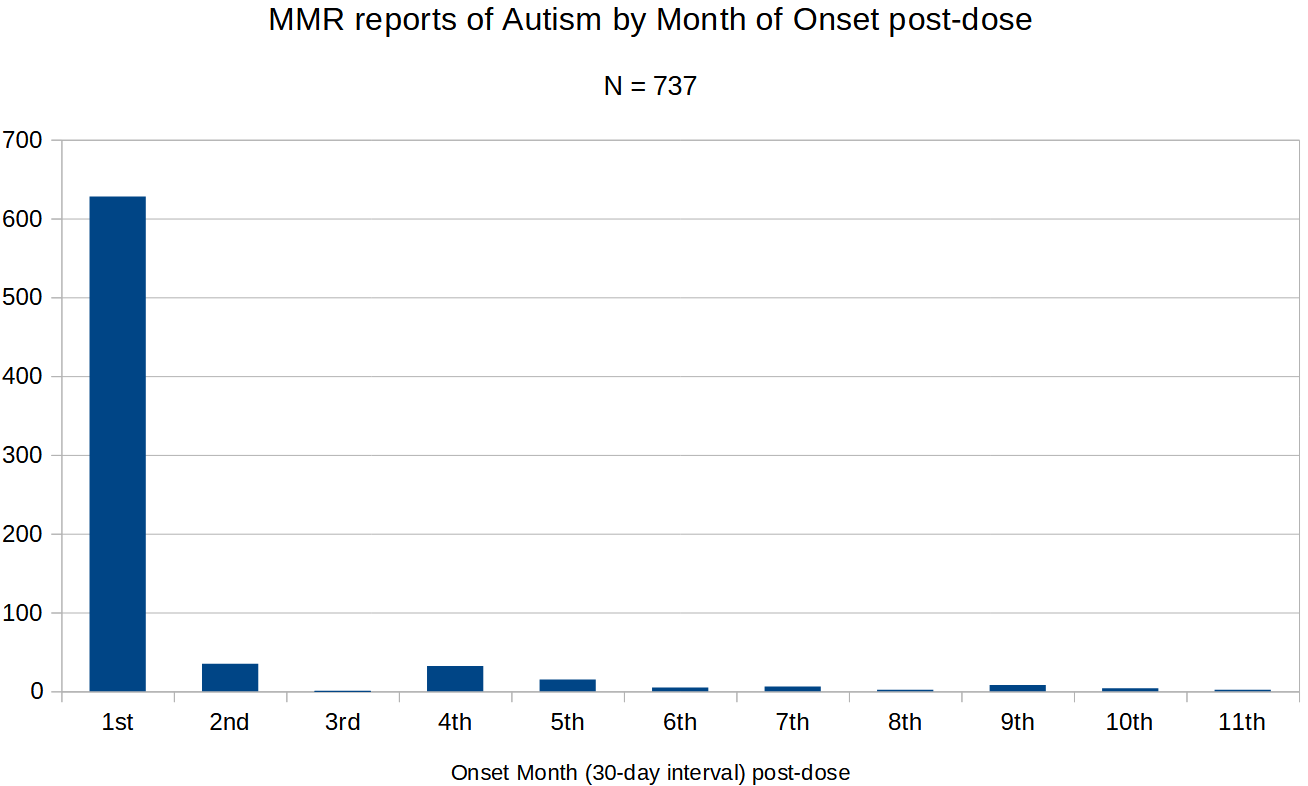
But when the observed reports are fitted into these 30-day intervals, you get this:
Because quick effects were expected from the more granular data shown at very top, the finding of over 600 out of 737 autism reportings being within 30 days of MMR vaccine dosing indicates a link between MMR and autism. When tested against the null hypothesis involving 40% monthly decay in the tendency to report, you get this:
[click to enlarge]
The p-value (cell J18) on the chi-squared Goodness-Of-Fit (GOF) test was so small that it has 132 zeroes after the decimal. Of note, the p-value is even smaller using straight-line depreciation (straight-line decay) in the tendency to report, and it is even smaller using uniform reporting (no diminishing tendency to report) as the null hypothesis.
This is now the second hypothesis test which firmly rejects the hypothesis that there is no link between MMR vaccines and autism. In both cases, the p-values were so small that they had a decimal that was followed by more than 100 zeroes. Here is the p-value from above in long form:
P-value =
0.00000 00000 00000 00000 00000 00000 00000 00000 00000 00000 00000 00000 00000 00000 00000 00000 00000 00000 00000 00000 00000 00000 00000 00000 00000 00000 00453
End Notes
Straight-line decay graph:


Keep up the good work. Bradford-Hill criteria for causation continue to frustrate vaccine supporters who want to obscure the truth.