

Part 6 of Nine Places where Vaccinating Kids led to Excessive Death
Part 6 of Nine Places where Vaccinating Kids led to Excessive Death
Luxembourg

The weekly deaths in kids under age 15 in Luxembourg appear to have a lot of variance associated with them. While average weekly excess death in kids — for the 70 weeks before vaccine coverage for kids had expanded — was 23% weekly excess death, the standard deviation was +/- 192%.
That’s a lot of variation in excess death, and it was enough to prevent differences from being statistically significant.
For the 40 weeks when there was nonzero (> 0%) vaccine coverage in kids, the average weekly excess death was 4 times higher than it was before vaccines rolled out — but the variation in weekly death was again too high for even a 4-fold increase in average excess death to reach signficance:
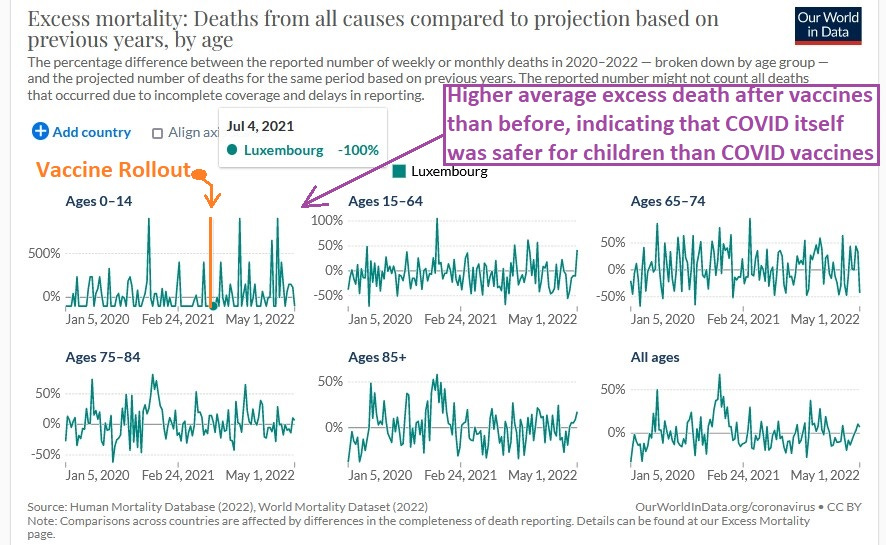
It is unclear why a first-world nation like Luxembourg would commonly have individual weeks when deaths are more than 3 times higher than expected — only to have “below-normal” death rates the next week, before spiking back up to death rates once again more than 3 times higher than expected.
That situation, where excess death is over 200%, appeared to happen more than 9 times in the graph above.
Relaxing the threshold to weekly deaths which are more than twice what is expected (excess death rate > 100%), there are more than a dozen weeks showing that, and possibly more than two dozen weeks showing that.
Are kid deaths in Luxembourg REALLY that variable on a weekly basis?
The variability could indicate data-doctoring, because the baseline values already include the variability in weekly death which had been seen in Luxembourg over the years from 2015 to 2019.
If deaths were not varying by so much during 2015 to 2019, then how come they do now?
One reason to introduce artificial variability into mortality rates is to hide increases in child deaths which may come after exposure to COVID vaccines. Having an average excess death rate which is quadruple what it was before vaccines is something which can be hidden behind “excessive variance.”
Hopefully, future investigations will reveal whether data-doctoring was used in Luxembourg in order to hide any increased child death rates there which stem from exposure to COVID vaccines.
Reference
[Share of people with at least one dose COVID-19 vaccine by age] — OWID. https://ourworldindata.org/covid-vaccinations
[P-scores by age group using five-year average baseline] — OWID. https://ourworldindata.org/excess-mortality-covid