

Part 9 of Nine Places where Vaccinating Kids led to Excessive Death
Part 9 of Nine Places where Vaccinating Kids led to Excessive Death
Spain

Something in Spain in 2020 was making kids abnormally-healthy, as evidenced by the average weekly excess death rate of -16%.
One possibility which could be explored — under the assumption that all big possibilities SHOULD be scientifically investigated — is that COVID was making kids in Spain more healthy than normal.
But the health of kids in Spain shifted after the COVID vaccine rolled out there — and even levels of vaccine uptake surpassing 80% in children over age 9 could not prevent weekly excess death numbers that reached higher than at any time during 2020:
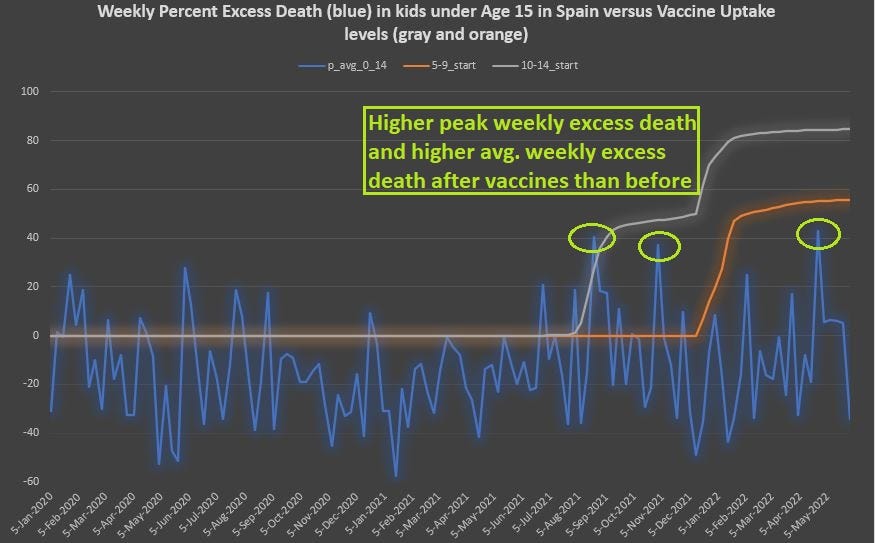
An argument can be made that, even though COVID vaccines led to an increase in the average weekly excess death in kids, at least it still stayed negative when averaged over all weeks.
This argument, while appearing on the surface to have substance, is actually a hollow argument though.
The statistically-significant increase in weekly excess death after COVID vaccines comes from the relative increase in excess death which the vaccines led to — regardless of whatever background conditions there were for keeping excess death in children low, overall.

In cell K10 of the Excel sheet, you see the p-value on a test of the hypothesis that COVID vaccines increase excess death in children, tested against the null hypothesis that the vaccines do not increase excess death.
If you’ve followed this series, you’ll realize that this is not the first time that COVID vaccines were shown to lead to a statistically-significant increase in excess death.
High-level critics might claim that the statistical test used on these data is inappropriate, because of an assumption that the data are not normally distributed.
But a QQ plot — a normality test — which shows a roughly-straight line and a high coefficient of determination (R-squared) should put such criticism to rest. When a coefficient of determination is close to 1.00 on a QQ plot like it is below, then it is a safe assumption that data are normally distributed:

Robust statistical evidence suggests that COVID vaccines can lead to excessive death in children, bringing child death rates up above what they were in those time periods prior to vaccine rollouts.
When robust statistical evidence shows a danger to something, the usual thing to do is to stop doing whatever it is — and to definitely stop PROMOTING it in the face of robust statistical evidence against it.
History will show whether government officials, after being granted a learning curve, aligned public policy with the robust statistical evidence which existed at the time — or whether their decision-making was overwhelmed by ulterior incentives which have yet to be discovered.
Reference
[Share of people with at least one dose COVID-19 vaccine by age] — OWID. https://ourworldindata.org/covid-vaccinations
[P-scores by age group using five-year average baseline] — OWID. https://ourworldindata.org/excess-mortality-covid