


Pfizer Trial COVID Deaths at Month 6
Post #1090

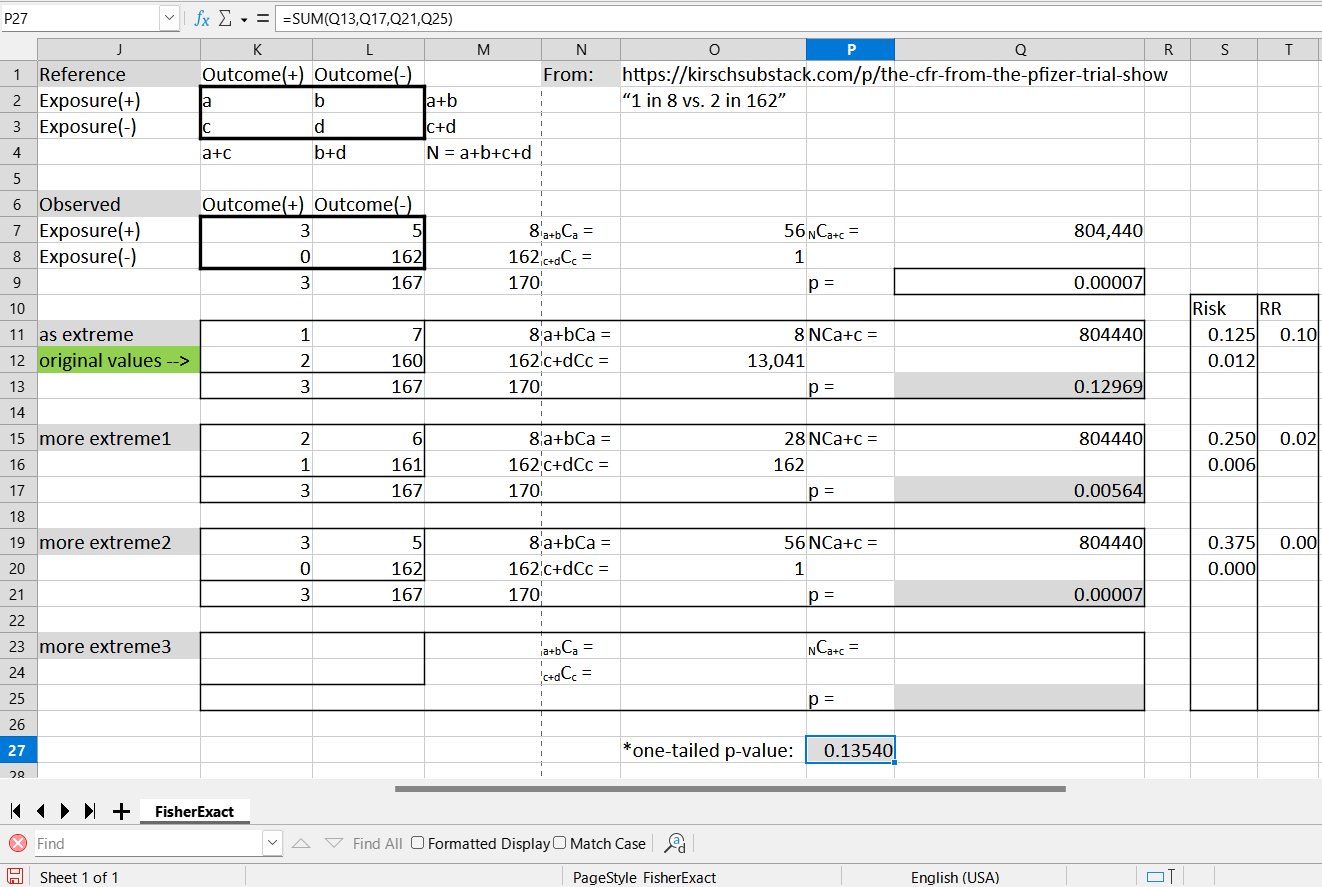
Steve Kirsch recently posted about the higher proportion of COVID cases leading to COVID death seen among jabbed trial participants in the first 6 months of the original Pfizer trial. He said it was alarming but not statistically significant. The data are such that a Fisher’s Exact Test should be used on it. So here it is …
[click to enlarge]
The nature of the test shows up at top-left: a 2x2 contingency table. The second box below it is utilized for putting in different cell counts, while keeping row totals constant, and column totals constant. The green box shows the original situation from the 6-month Pfizer trial: those exposed to jabs had 1 death [a] for 8 infections [a+b].
Those not exposed had 2 deaths [c] for 162 infections [c+d]. Combinatorics are used at right to compute the probability — with those exact row totals and column totals — of finding something as extreme as what was found, and then something one step more extreme, and so on, and so on. The final p-value is the sum of those probabilities.