

Positive Association of Jabs with ICU Admissions
Positive Association of Jabs with ICU Admissions
Evidence from Chile

In this Substack, it was discovered that Hungary had pretty much given up on the COVID jab by 4 Jun 2022 — so that not even 2 people in every 100 would become jabbed in the 6 months that followed. But it was also discovered that not getting the COVID jab actually had a positive result: less ICU admissions for COVID.
This Substack is the first part of a series looking deeper into the relationship of “recent jabs” and “current weekly ICU admissions.” Dates covering the first 6 months of Omicron are used. Here is the association of jabs vs. ICU for the entire period in Chile:
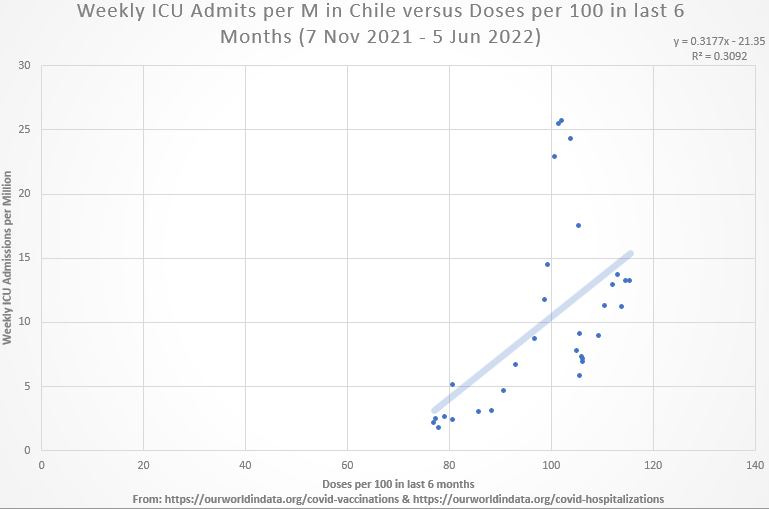
As the coefficient of determination (R-squared) at top right shows, the data in aggregate explains 31% (30.92%) of the variation in weekly ICU admissions per million.
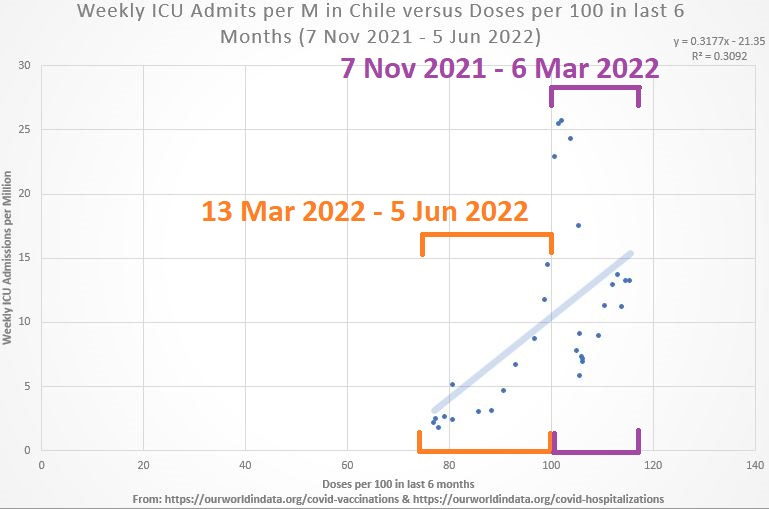
But all 6-month jab rates below 100 per 100 people took place after 6 Mar 2022, and there appears to be at least two clusters which can be roughly separated by that time point, like this:
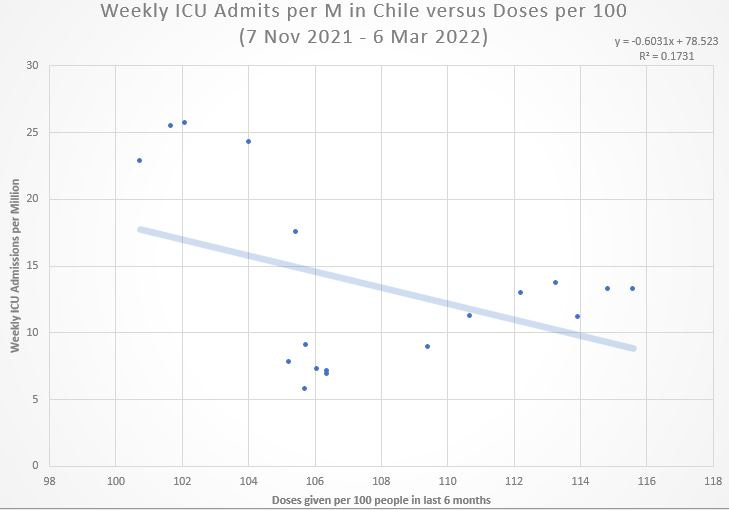
Taking each time window separately, the first period failed to reach statistical significance, with an R-squared of just 0.1731:
The later time window (period after Omicron BA.1) shows clear evidence of COVID jabs leading to more and more ICU admissions:
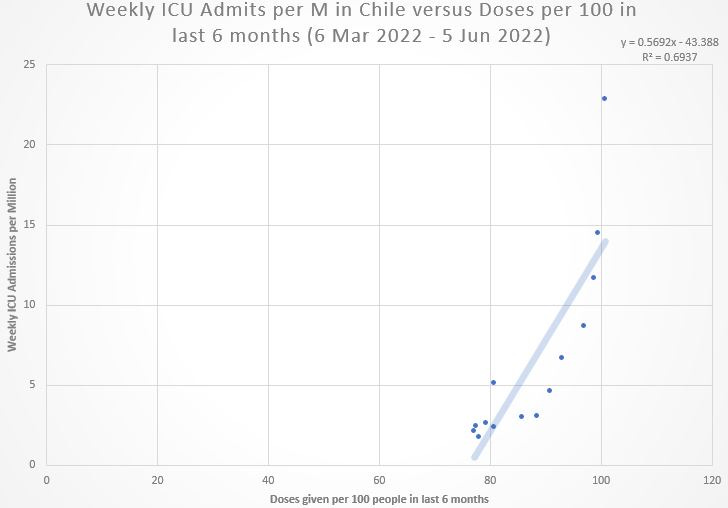
But the R-squared, though statistically-significant, was still modest, and the pattern suggests an exponential relationship between prior COVID jabs and current ICU admissions. The exponential model was an even better fit to the data:
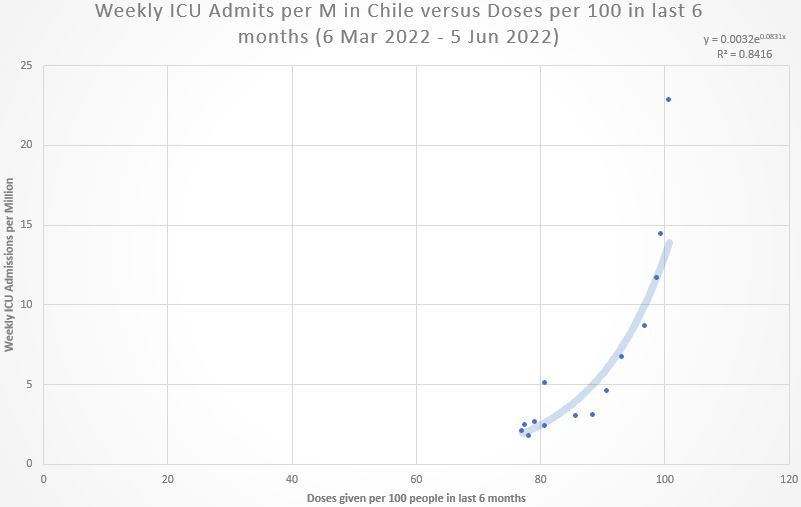
The exponential model explains 15% more of the variation in ICU admission rates, and the lamda value in the exponent was 0.0831, meaning that, for every additional 8% of the Chilean population jabbed in the prior 6 months, the ICU admission rate doubled:
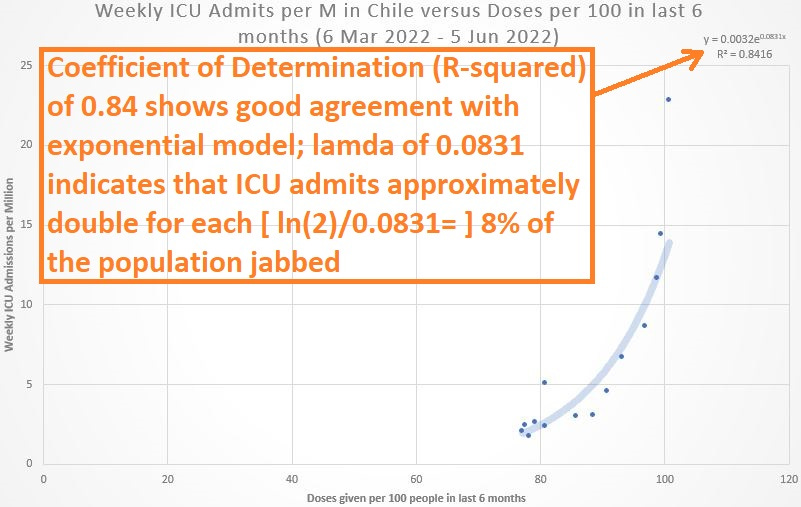
Evidence from Chile, at least after Omicron BA.1, strongly suggests that COVID jabs put you into the ICU ward — i.e., they are counter-productive or contrary-to-purpose.
Comparison to flu
In the worst recent season of flu (2017/18), the annual average weekly ICU admission rate was 2.6 per million, but the peak weekly ICU admission rate can be estimated from the peak flu hospitalization rate, because ICU admissions were 15.2% of hospital admissions, when using the largest ‘ethnicity group’ observed (whites).
The peak weekly flu hospitalization rate was 102 weekly flu hospitalizations per million, making the peak ICU rate out to be 15.5 weekly ICU admissions per million. Yet Chile is showing weeks with over 25 weekly ICU admissions per million.
Reference
[just over 15% of flu hospitalizations were ICU admissions in 2017/18] — O’Halloran AC, Holstein R, Cummings C, et al. Rates of influenza-associated hospitalization, intensive care unit admission, and in-hospital death by race and ethnicity in the United States from 2009 to 2019. JAMA Netw Open. 2021;4(8):e2121880. doi: 10.1001/jamanetworkopen.2021.21880