

Post-Omicron Excess Death Peaks?
Post-Omicron Excess Death Peaks?
Post #760

In this prior installment, it was discovered that respiratory disease has the capability of increasing weekly excess death up to an upper limit of about 100% weekly excess. But especially suspicious would be populations where the peak of weekly excess death was not found until after the predominance of Omicron variant.
The reason that it’d be suspicious is because Omicron variant COVID is less lethal than flu:

To get 160 deaths from Omicron required over 800,000 COVID infections — about 5,000 infections per COVID death. But with flu, you find a death for every 700-to-1400 infections — making seasonal influenza over 3 times more deadly than Omicron. If those 814,003 infections had been flu, then 600-to-1,200 deaths would be expected.
Importantly, those remaining unjabbed had the greatest (72%) drop in mortality when moving from Delta variant to Omicron — indicating that the reduction in death due to Omicron (compared to Delta) was not from people taking the COVID shots, but it was from the inherently-low lethality of Omicron as compared to Delta, instead.
Omicron is simply 72% less lethal than Delta variant.
But if flu is 3 times more deadly than Omicron, then this chart is hard to explain:
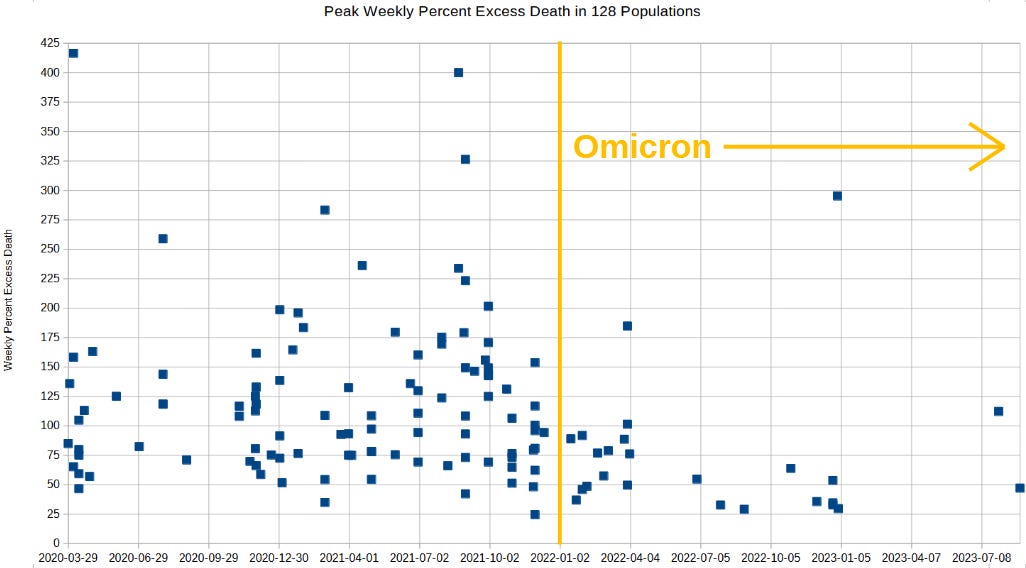
There are at least two dozen populations which did not experience their peak weekly excess death until after Omicron variant predominated. Because the circulating respiratory disease (Omicron) was less lethal than flu, a prime suspect for explaining those peak excesses of death — from 1 Jan 2020 forward — is the COVID mRNA shot.
Circulating respiratory disease does not explain these belated excess death peaks, but the experimental COVID shots can explain why the excess death did not peak out (reach its maximum value) until 2022 or later.
Flu Infections per death, by season (adapted from CDC)
2012/13
Symptomatic Cases: 33,679,171
Infections: 40,094,251
Deaths: 42,570
Infections per Death: 942
2013/14
Symptomatic Cases: 29,739,994
Infections: 35,404,755
Deaths: 37,930
Infections per Death: 933
2014/15
Symptomatic Cases: 30,165,452
Infections: 35,911,252
Deaths: 51,376
Infections per Death: 699
2015/16
Symptomatic Cases: 23,504,319
Infections: 27,981,332
Deaths: 22,705
Infections per Death: 1,232
2016/17
Symptomatic Cases: 29,220,523
Infections: 34,786,337
Deaths: 38,320
Infections per Death: 908
2017/18 (2021 revision)
Symptomatic Cases: 41,043,550
Infections: 48,861,369
Deaths: 51,646
Infections per Death: 946
2018/19
Symptomatic Cases: 28,908,712
Infections: 34,415,133
Deaths: 27,619
Infections per Death: 1,246
Reference
[5,000 Omicron infections just to get one single COVID death] — Ward IL, Bermingham C, Ayoubkhani D, Gethings OJ, Pouwels KB, Yates T, Khunti K, Hippisley-Cox J, Banerjee A, Walker AS, Nafilyan V. Risk of covid-19 related deaths for SARS-CoV-2 omicron (B.1.1.529) compared with delta (B.1.617.2): retrospective cohort study. BMJ. 2022 Aug 2;378:e070695. doi: 10.1136/bmj-2022-070695. PMID: 35918098; PMCID: PMC9344192. https://pubmed.ncbi.nlm.nih.gov/35918098/
“We found the relative risk was reduced for two doses and for a booster dose for omicron compared with delta (two doses: hazard ratio 0.61, 95% confidence interval 0.43 to 0.90; booster: 0.29, 0.21 to 0.40) and for unvaccinated people (0.28, 0.23 to 0.35; fig 2).”