

Pre-COVID evidence of Police State
Pre-COVID evidence of Police State
Analyzing findings of a BMJ study published in June 2022

Police states are places where an excess amount of people are detained and an excess amount of people are dying. The amounts of people detained and dying can tell you if you live under a police state in two ways:
1) comparison to historic police states, such as NAZI Germany
2) comparison to yourself (a time trend in incarceration and death)
In June of 2022, a study was published in the British Medical Journal (BMJ) which looked at age-adjusted death rates all of the way down to the county level. The most extreme finding of the study was a growing lopsidedness to death in America.
In 2001, non-Hispanic white (NHW) Republicans died at a rate (858.1 per 100,000) that was 3% higher than NHW Democrats (833.4 per 100,000). But in 2019, after several years of implementation of the Affordable Care Act, those same Republicans died at a rate that was 15% higher.
These findings are found in Table 1 in the reference below.
The silver lining is that the age-adjusted death rate came down during that time, but almost all of the improvement was seen among Democrats. Assuming the percentage differences are stable and constant across all working-age age brackets, an alarming trend is seen:
2001 Overall Death Rate with 99% Confidence Bounds (blue)

2019 Overall Death Rate with 99% Confidence Bounds (blue)
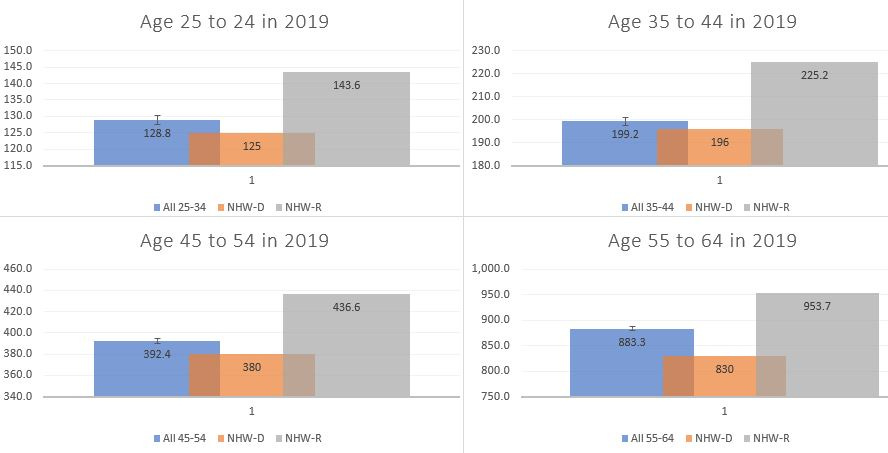
Notice how Republicans were always below the overall death rate in each age group in 2001 and then, after several years of implementation of the Affordable Care Act, Republicans were always above the overall death rate (in each age group).
Here are those Democrat and Republican death rates in a list format:
Democrats aged 25 to 34
2001: 95
2019: 125
Republicans aged 25 to 34
2001: 97.8
2019: 143.6 ← 47% more death than in 2001
Democrats aged 35 to 44
2001: 186
2019: 196
Republicans aged 35 to 44
2001: 191.5
2019: 225.2 ← 18% more death than in 2001
Democrats aged 45 to 54
2001: 390
2019: 380
Republicans aged 45 to 54
2001: 401.6
2019: 436.6 ← 9% more death than in 2001
Democrats aged 55 to 64
2001: 911
2019: 830
Republicans aged 55 to 64
2001: 938
2019: 953.7 ← 17% more death than in 2001
That’s almost double-digit death increases across the board for the Republicans.
Reference
[BMJ study where largest difference found was between white Democrats and Republicans] — BMJ 2022;377:e069308. http://dx.doi.org/10.1136/bmj-2021-069308 and PDF available at: https://www.bmj.com/content/bmj/377/bmj-2021-069308.full.pdf
[National Vital Statistics Report #52] — CDC. National Center for Health Statistics. https://www.cdc.gov/nchs/data/nvsr/nvsr52/nvsr52_03.pdf
[National Vital Statistics Report #70] — CDC. National Center for Health Statistics. https://www.cdc.gov/nchs/data/nvsr/nvsr70/nvsr70-08-508.pdf