

To detect disproportional adverse event (AE) reporting to VAERS, the CDC uses the proportional reporting ratio (PRR). Using just numbers from the USA only, here is an example of a PRR for Pulmonary Embolism (PE), for all COVID shots given before or during July 2021 (AER = adverse event report):
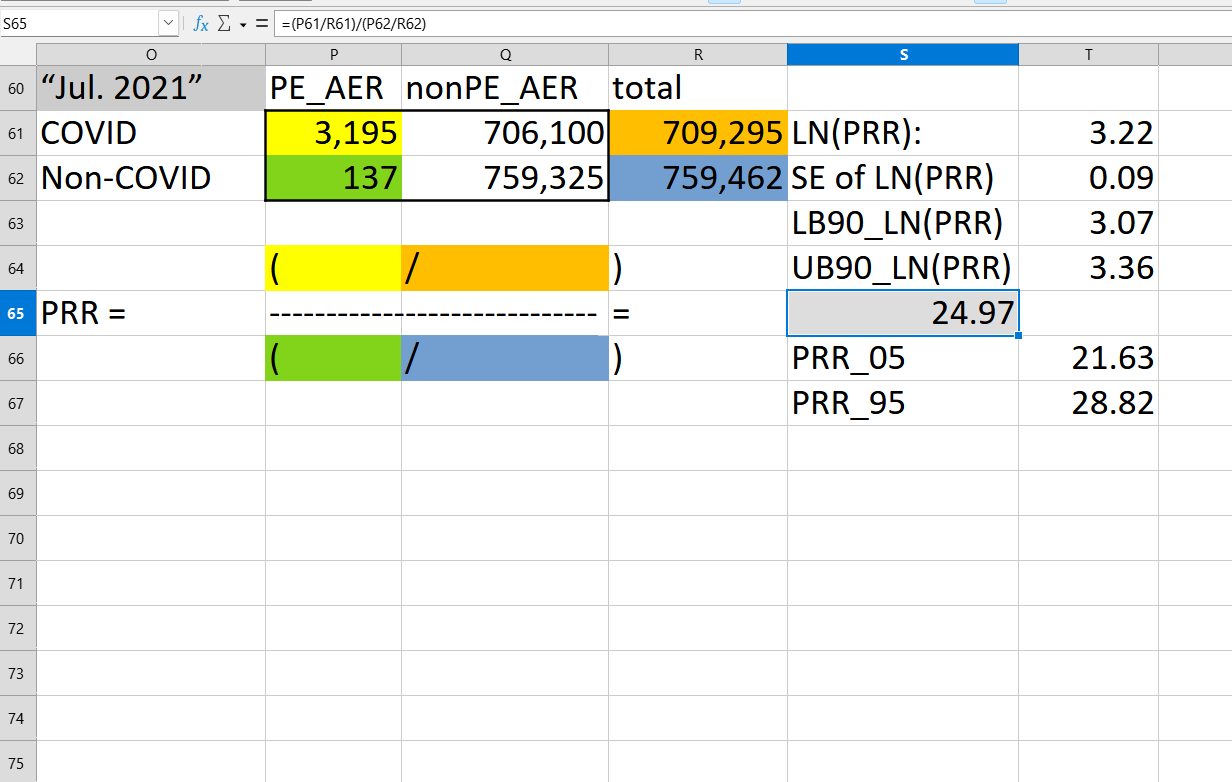
In cell P61 (yellow) is the count of all reports of Pulmonary Embolism from COVID shots. In cell R61 (orange) is the total count of all reports of any kind for COVID shots. In cell P62 (green) is the count of all reports of Pulmonary Embolism for all non-COVID vaccines. In cell R62 (blue) is the total count of all non-COVID AE reports.
The proportional reporting ratio (PRR) is computed as:
The PRR for the accumulated reports up to and including July 2021 was a very high 24.97. In order to account for variability in the estimate, you can use the lower bound of a 90% confidence interval around the PRR, or the 5th percentile value of the PRR, PRR_05. The PRR_05 was still 21.63 — indicating a very strong safety signal for PE.
And on top of that, that is worse than what it had started off as:

[click to enlarge]
At left are the totals of all reports of PE and all reports of any kind for both COVID shots and for non-COVID shots in VAERS. Notice in column F that in some months, there were no new PE reports from non-COVID shots at all. But for those taking COVID shots in March 2021, there were 876 reports of PE to VAERS (cell F44).
The PRR peaked in April 2021 at 25.41 (PRR_05 = 21.96). But by July, it had not come down appreciably — indicating that, not only were COVID shots throwing a Safety Signal, but they were throwing a Safety Signal that was robust over time. But curiously, the CDC and FDA were mentioning how COVID shots were safe.
But the 90% lower bound (the PRR_05) of the PRR tells us a much different story. It speaks loudly about a new injection leading to a lot of blood clots in the lungs. CDC could be using the PRR_05 instead of complaining about the variability in the PRR values. Forming confidence intervals is how you account for such variability.
And their scientists should know this. Every PRR_05 with a value of 2.0 or more should be investigated for causality — just like FDA does with their EB_05 values.
Reference
[VAERS search tool] — https://medalerts.org/vaersdb/index.php
[finding confidence limits on risk ratios from a 2x2 contingency table] — Morris JA, Gardner MJ. Calculating confidence intervals for relative risks (odds ratios) and standardised ratios and rates. Br Med J (Clin Res Ed). 1988 May 7;296(6632):1313-6. doi: 10.1136/bmj.296.6632.1313. PMID: 3133061; PMCID: PMC2545775. https://pmc.ncbi.nlm.nih.gov/articles/PMC25455775
